There are plenty of website metrics out there, and just as many tools to track them.
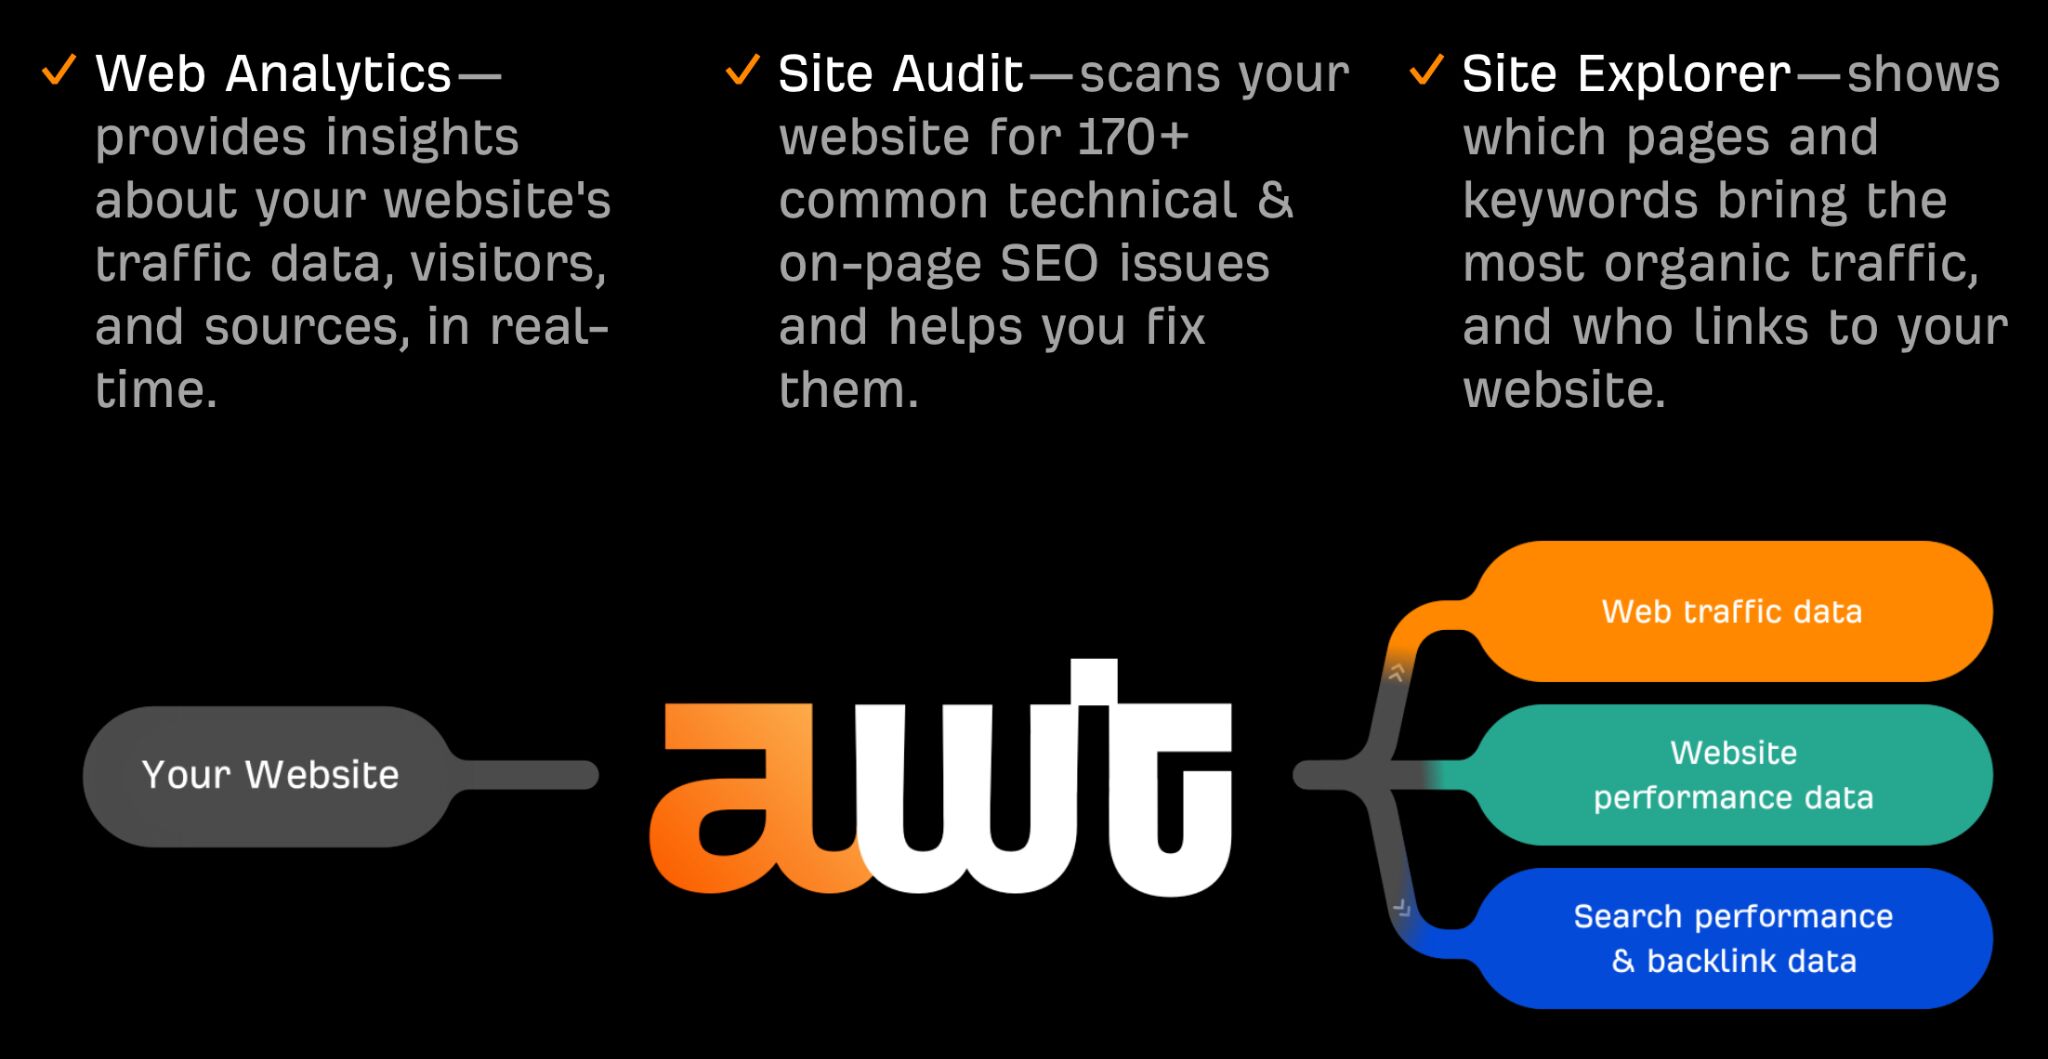
So, to clear up the confusion, I’ll show you the key metrics that really matter, explain how to make sense of them, and show you how to do it all with one free, privacy-friendly tool that’s ready for the AI age.
I’ll also suggest some other tools you can use if you’re looking for different features or have specific needs.
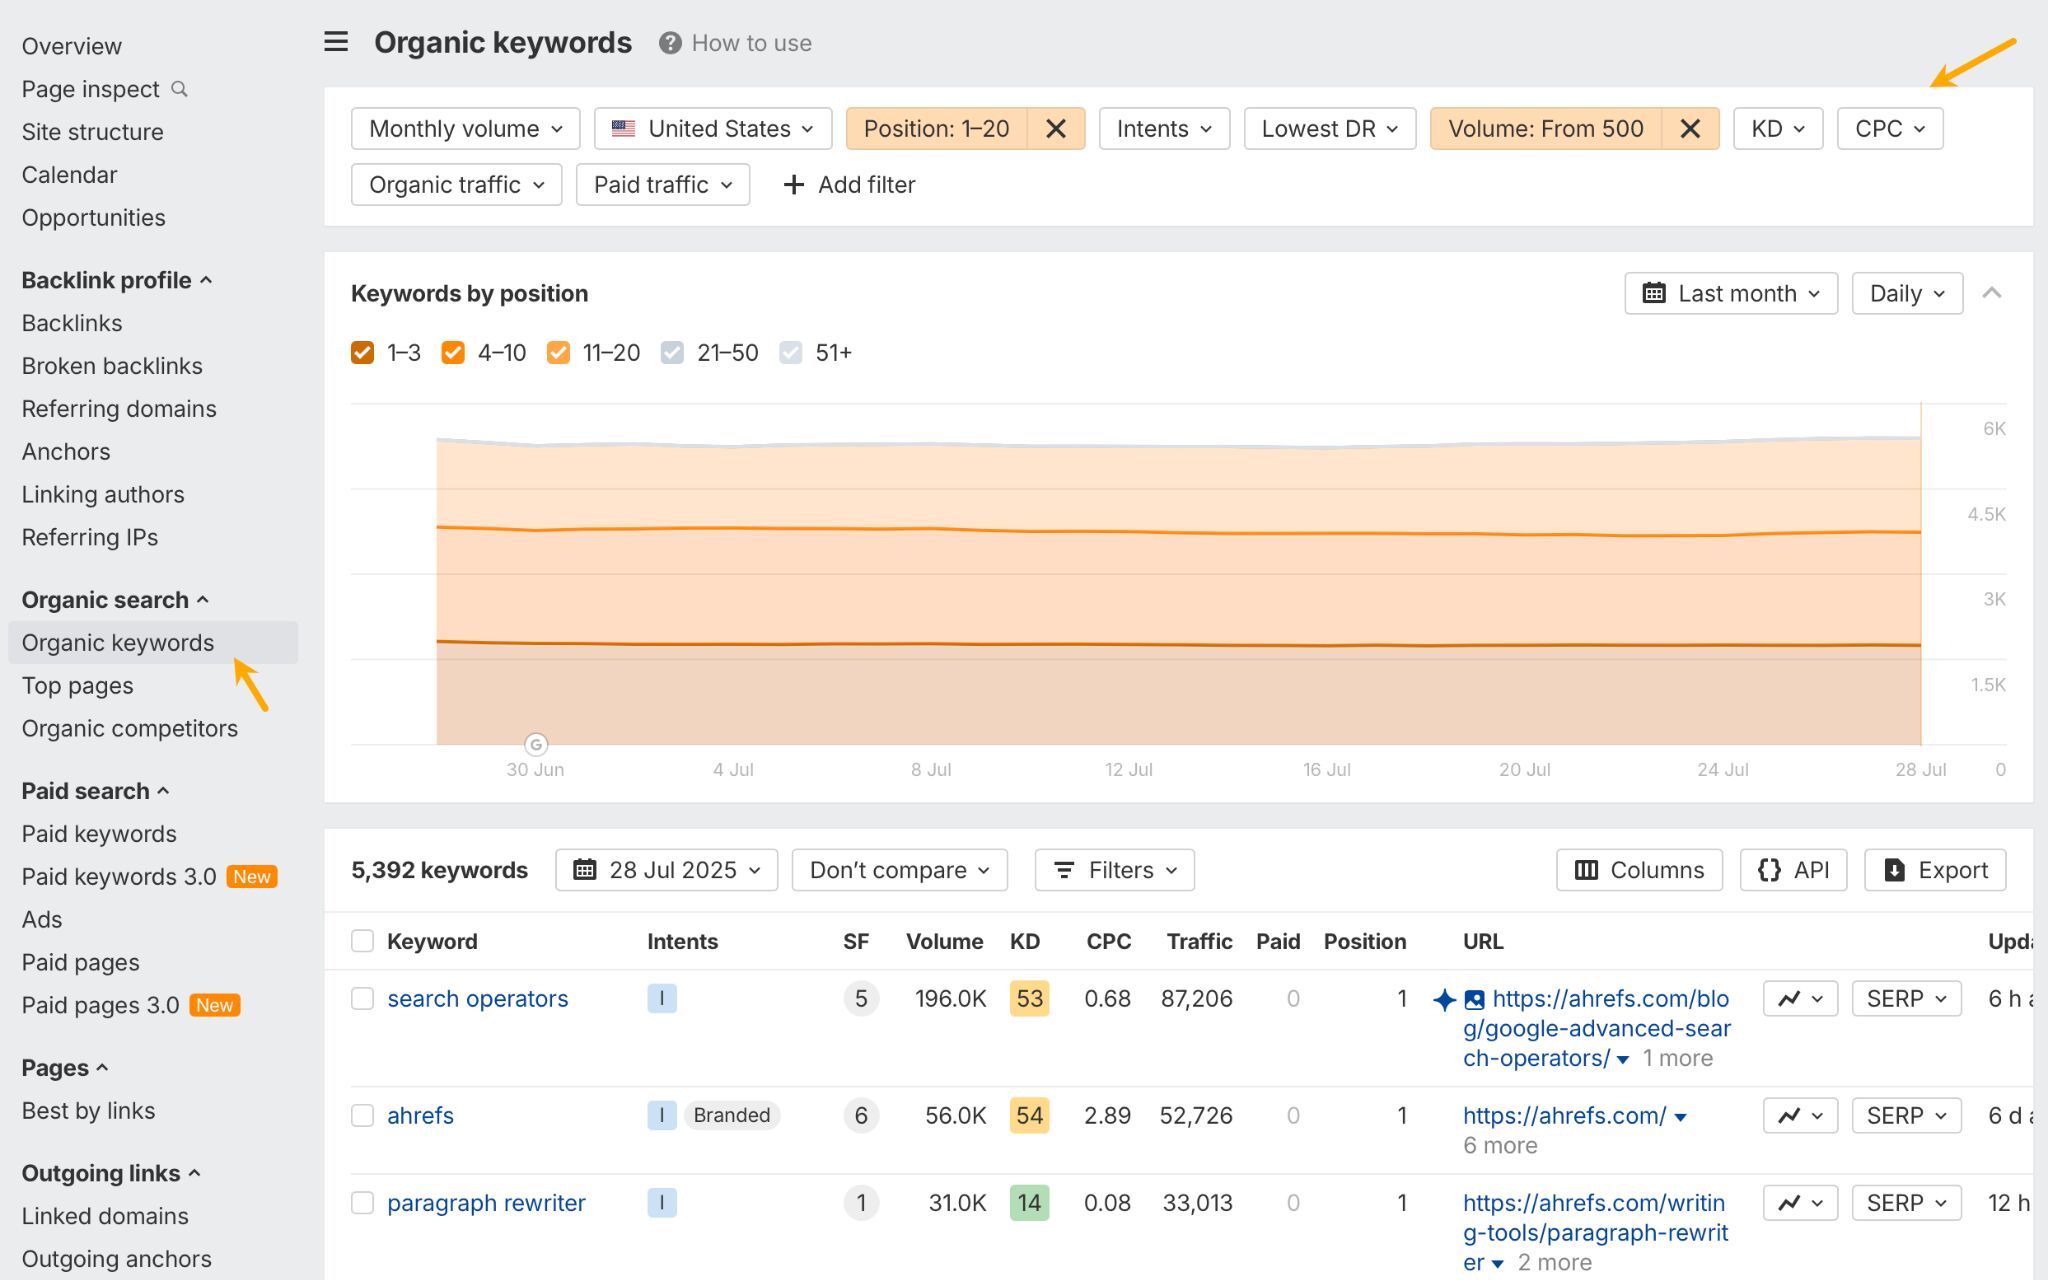
Keyword rankings show which search terms bring people to your site without paid advertising. When someone searches for “how to bake sourdough bread” and finds your recipe, that’s organic traffic driven by your keyword rankings.
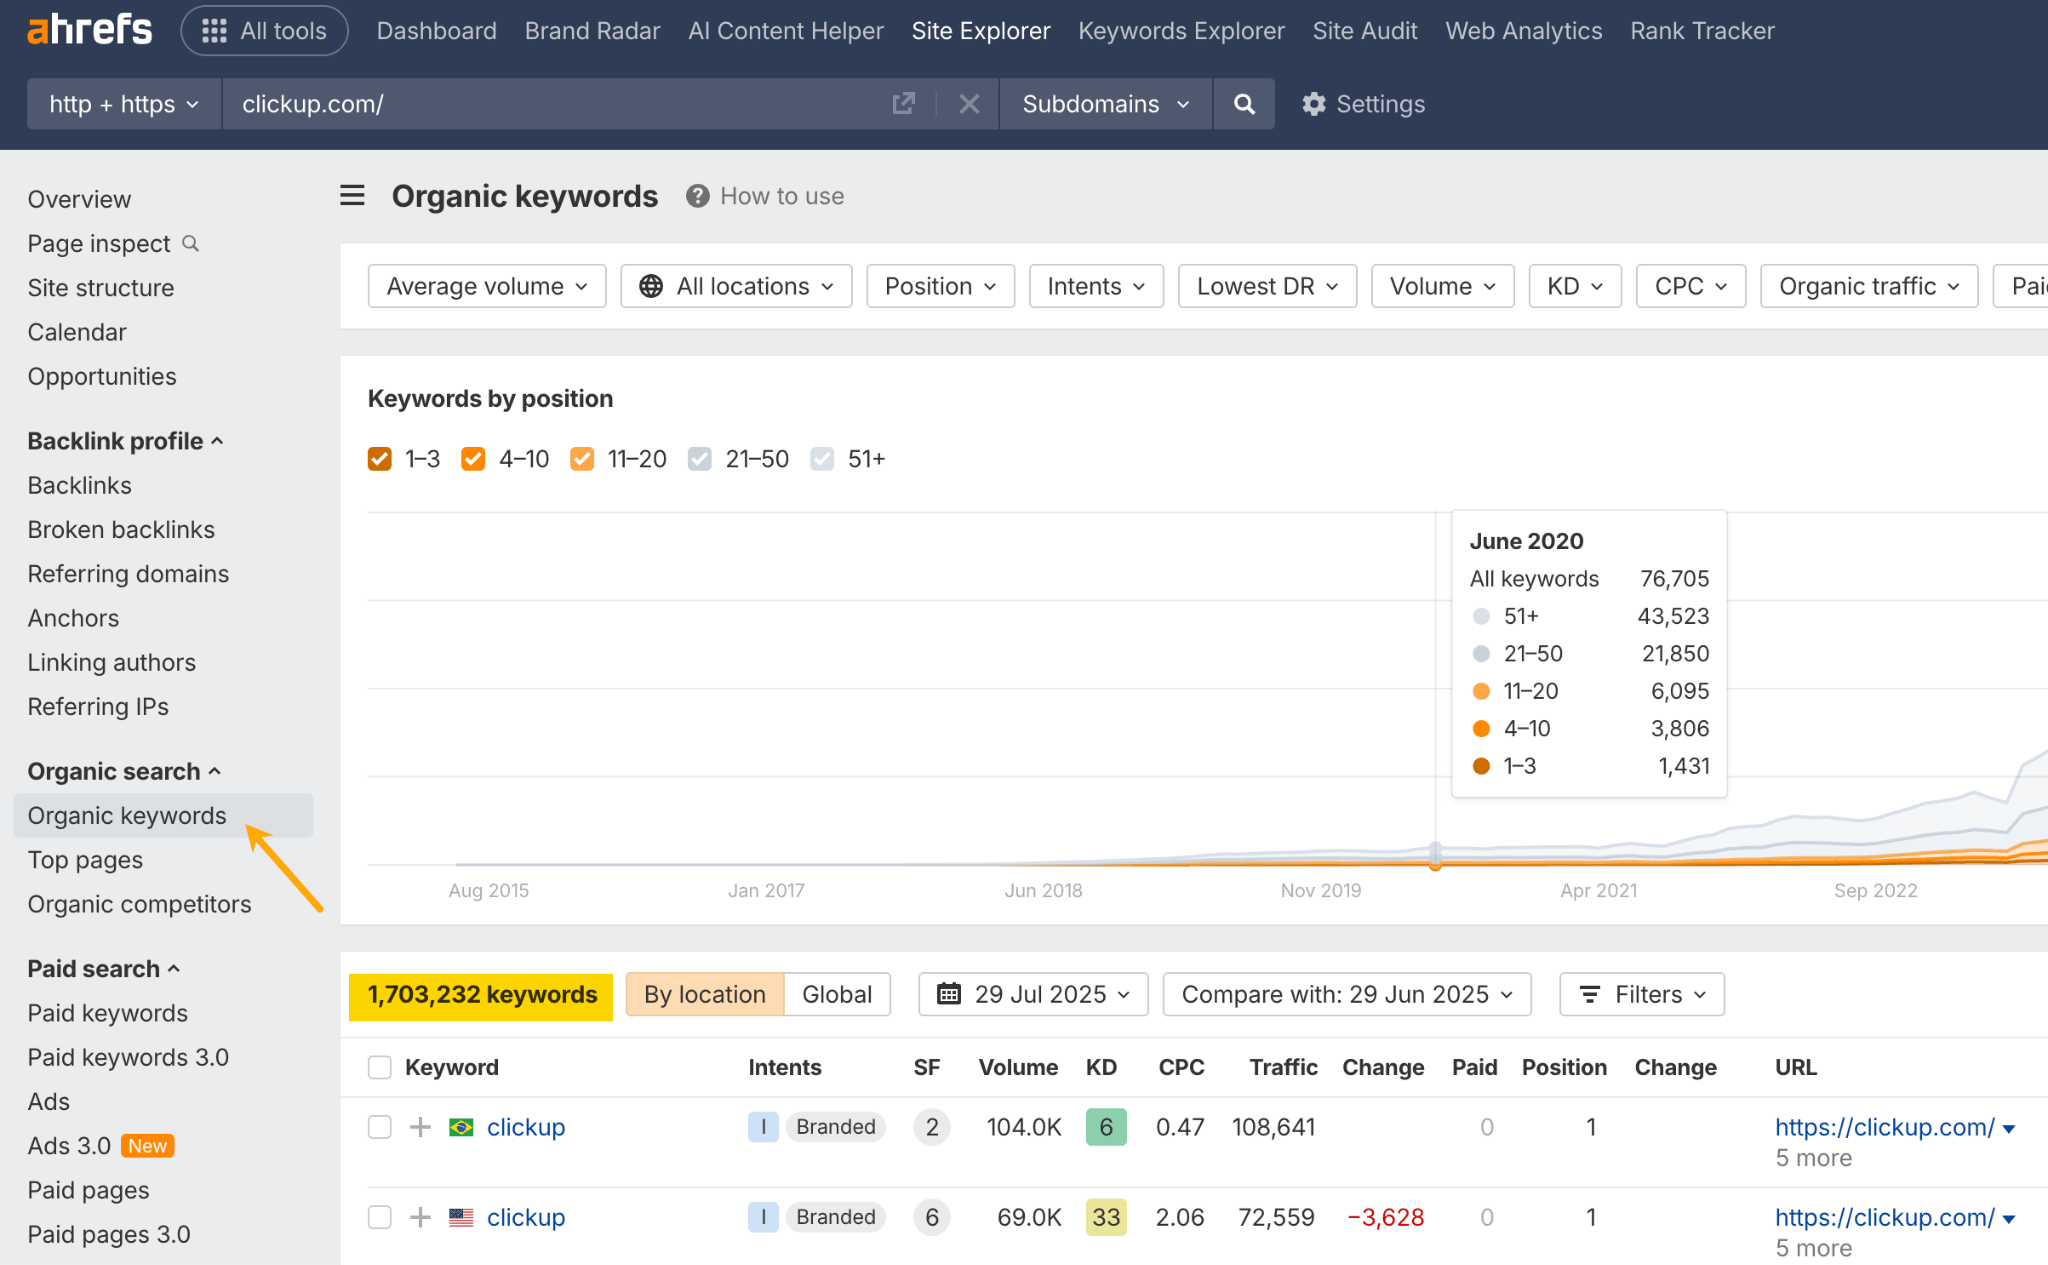
To get data on your Keywords in AWT, open the Site Explorer tool and click on the Organic keywords report. You can also set up a filter to track important keywords. In this example, I’ve set the filters to Positions 1-20, and search volume min. 500. This shows me the best-performing target keywords.
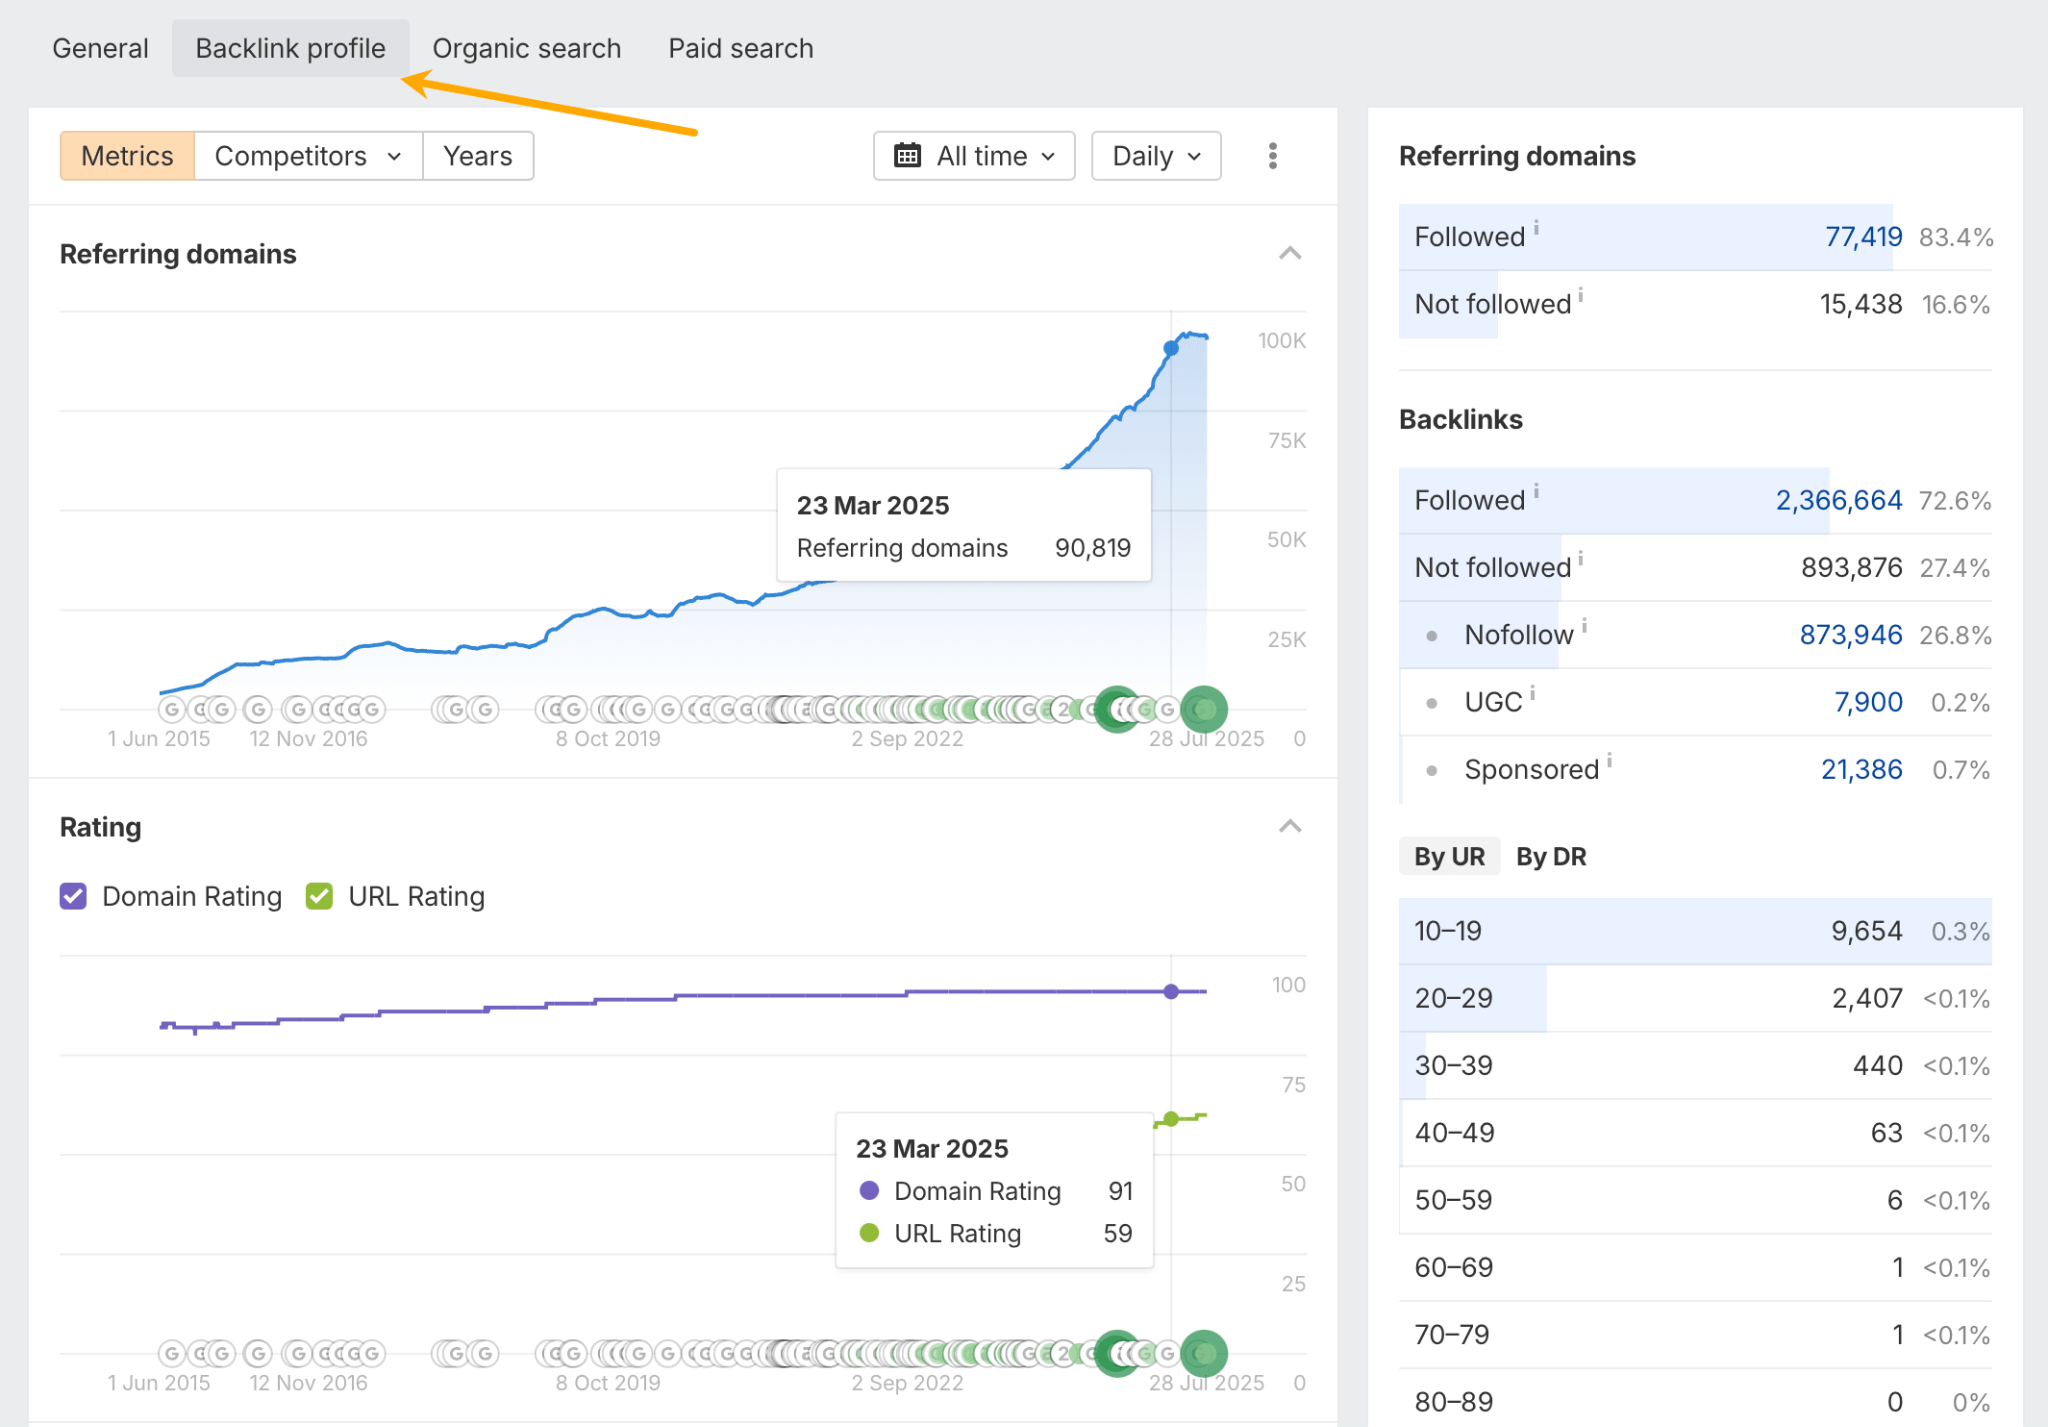
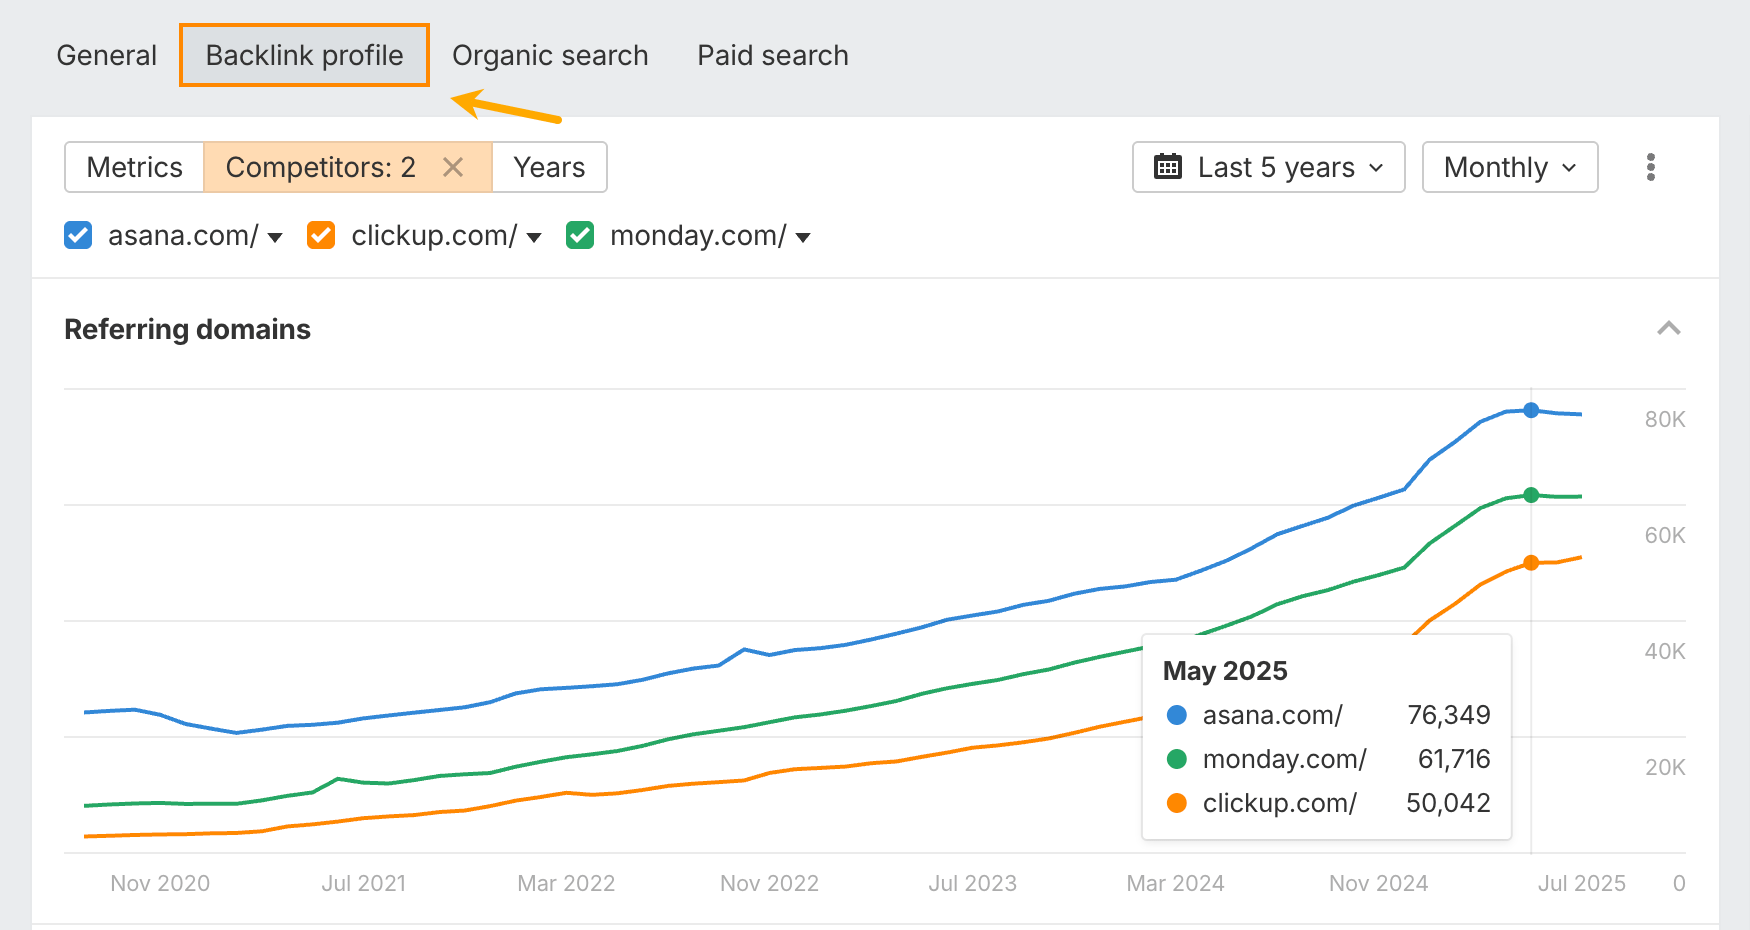
Referring domain growth measures how many other websites link to yours. When a food blog links to your sourdough recipe or a business publication references your marketing guide, those backlinks signal to search engines that your content is valuable and trustworthy.
Quality matters more than quantity; one link from a respected industry publication is worth more than dozens from low-quality sites.
Get referring domain data by clicking on the Backlink profile tab in Site Explorer’s Overview report.
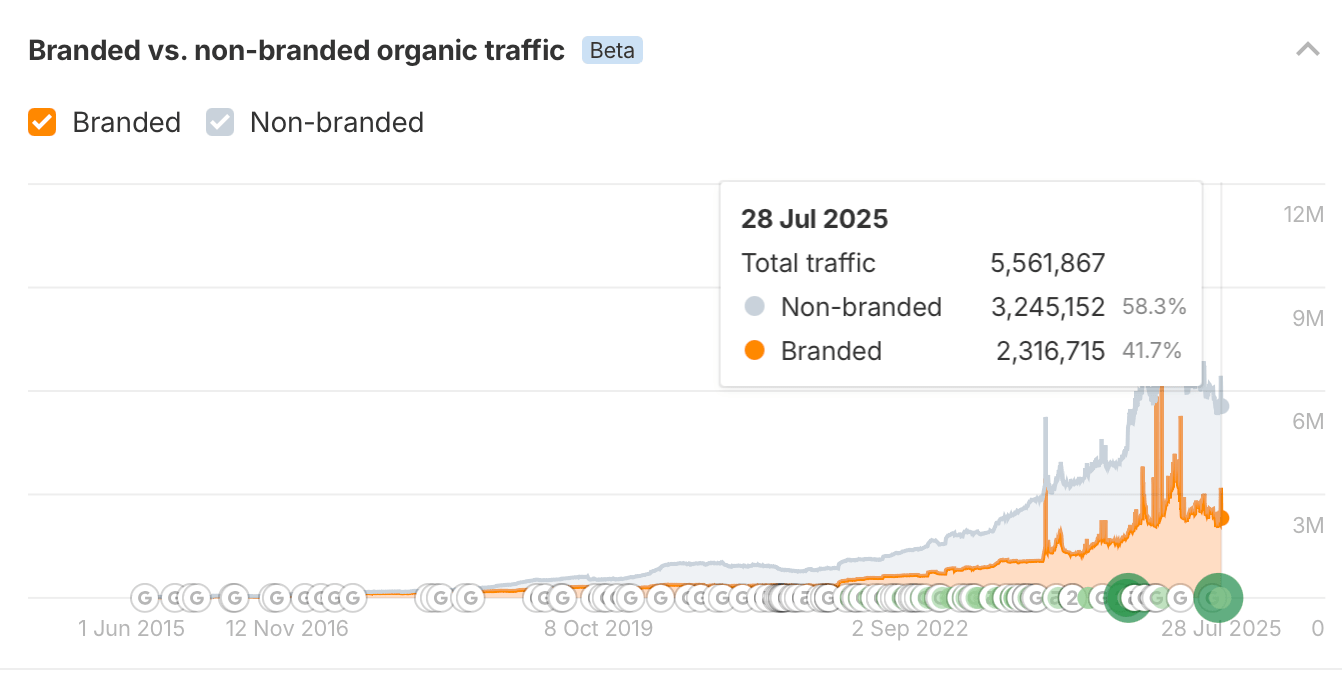
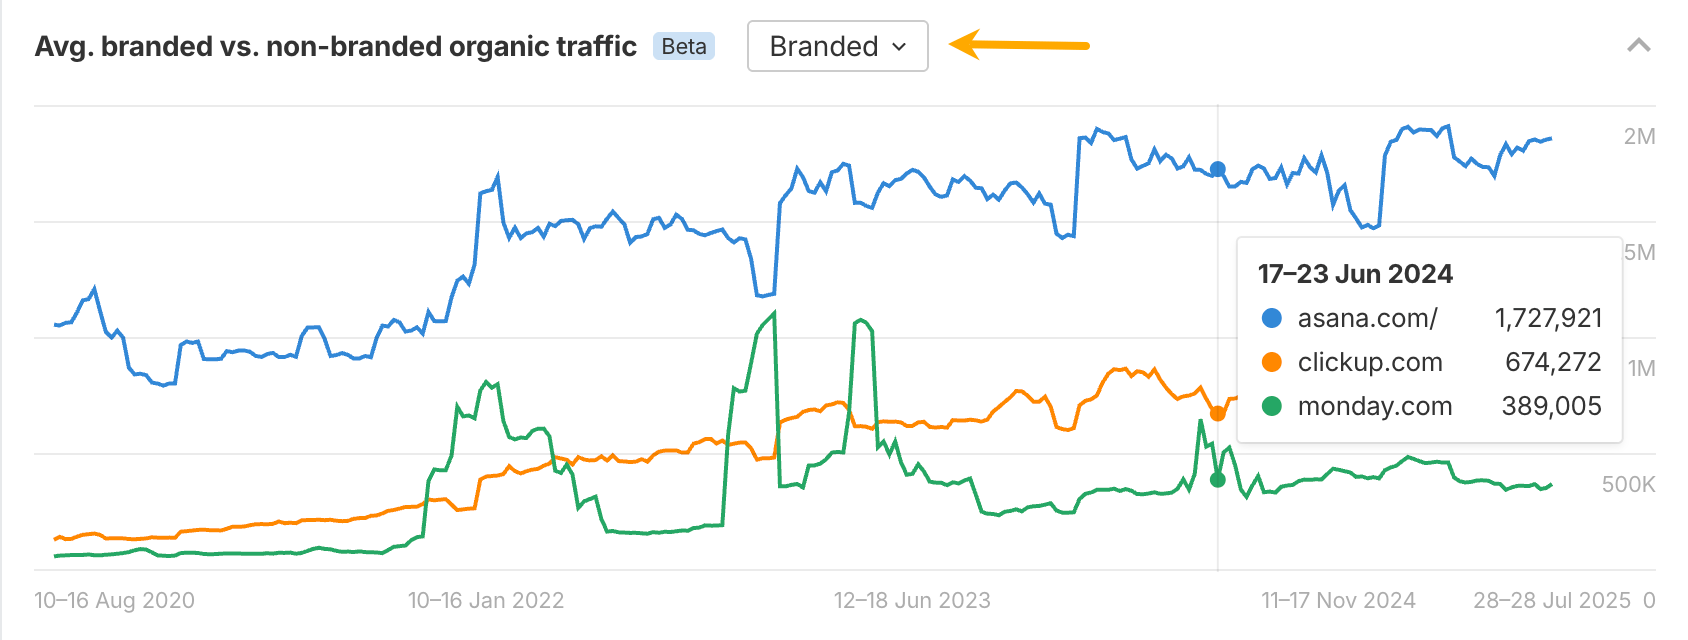
Branded vs. unbranded traffic. Branded traffic comes from people searching specifically for your company or products (like “ahrefs keywords explorer”). Unbranded traffic comes from people searching for general topics you cover (for example, “keyword research”).
Both are valuable: branded traffic shows you’re building recognition, while unbranded traffic demonstrates your ability to attract new audiences who don’t yet know your brand but are searching for solutions you provide.
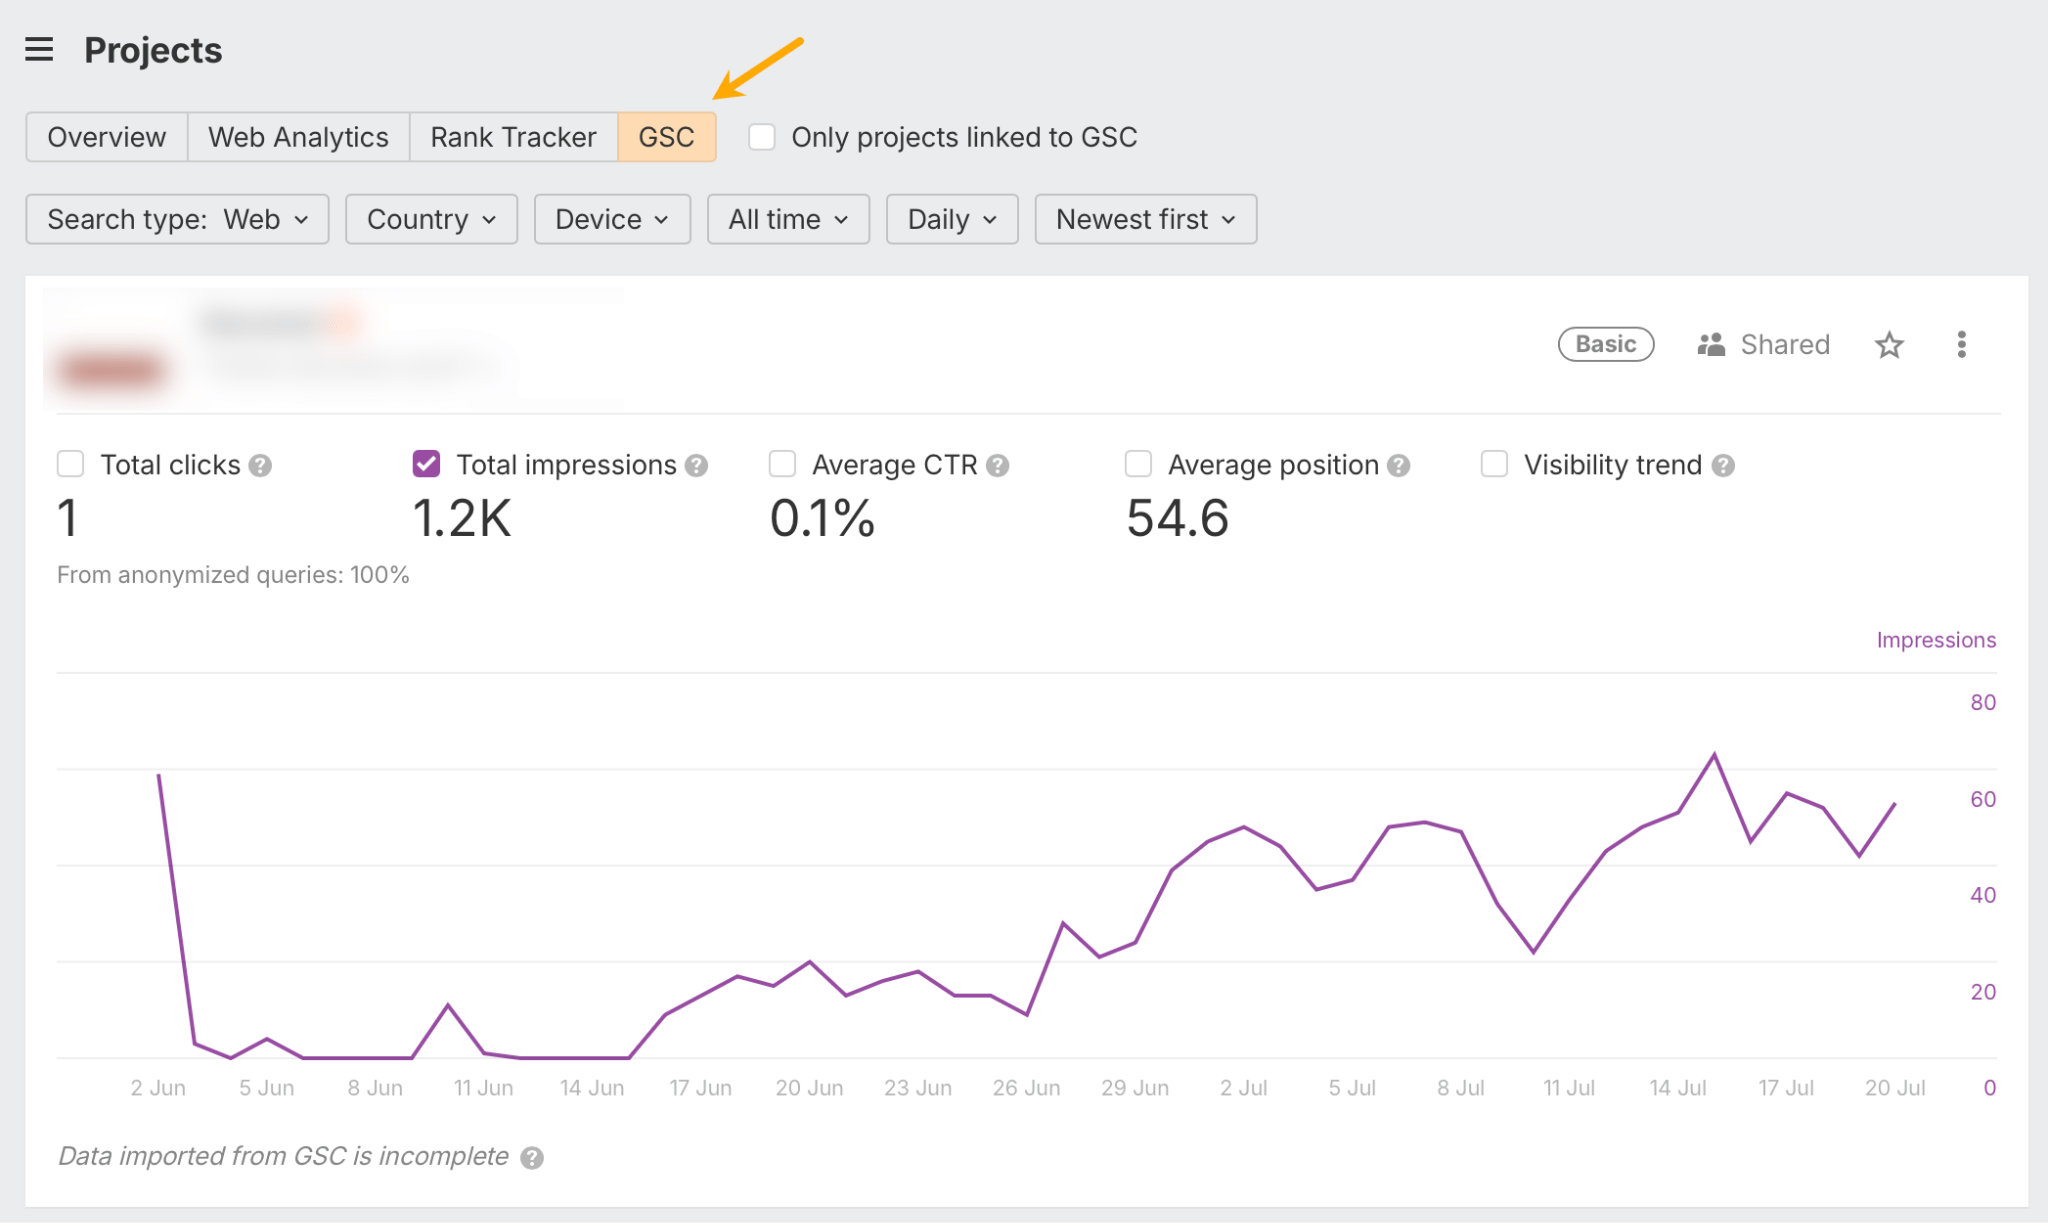
While in the overview report, scroll down a bit, and you’ll see the branded vs non-branded chart.
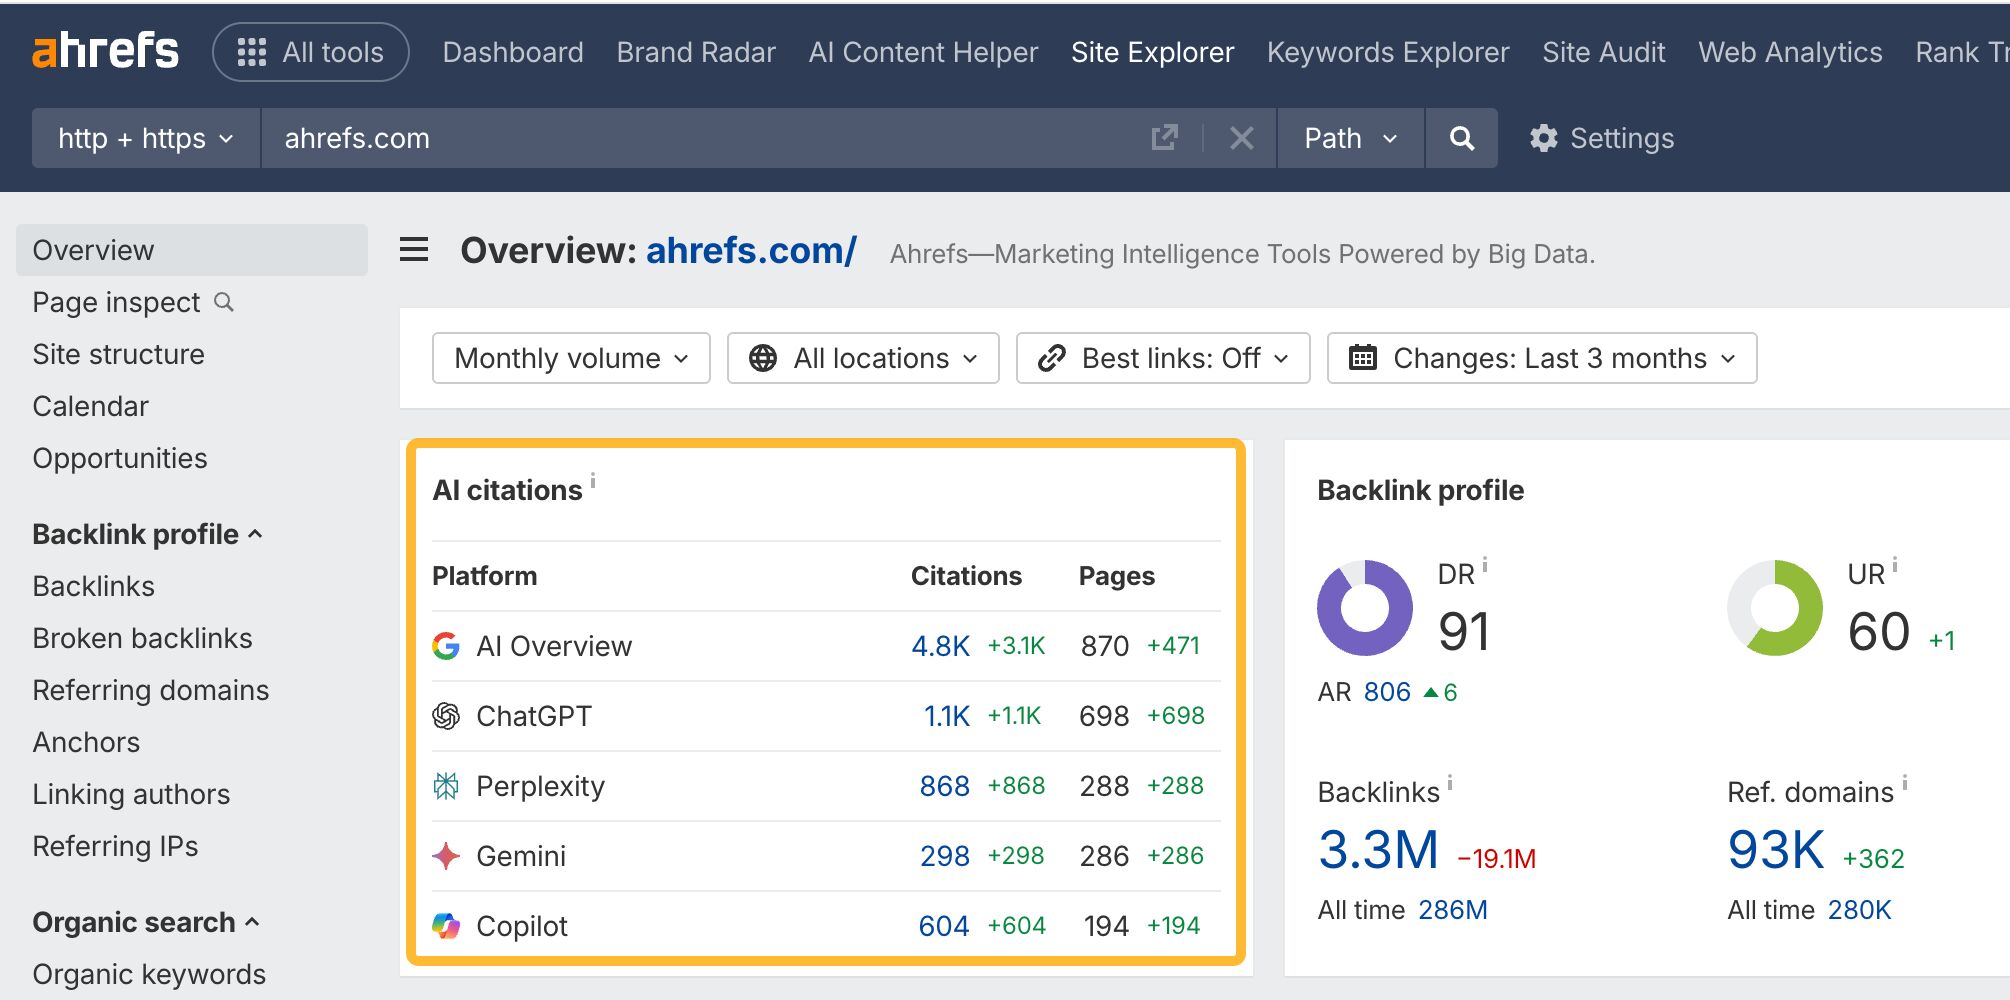
Ahrefs Webmaster Tools also monitors when AI tools cite your content as source material in their responses, even when users don’t click through to visit your website.
Citation visibility shows your content’s influence beyond traditional metrics. When ChatGPT or Perplexity references your research, quotes your expertise, or uses your content to answer questions, that’s valuable brand exposure and authority building, even if it doesn’t generate immediate traffic.
You can find your AI citation count with a breakdown of sources in the Overview report.
Tip
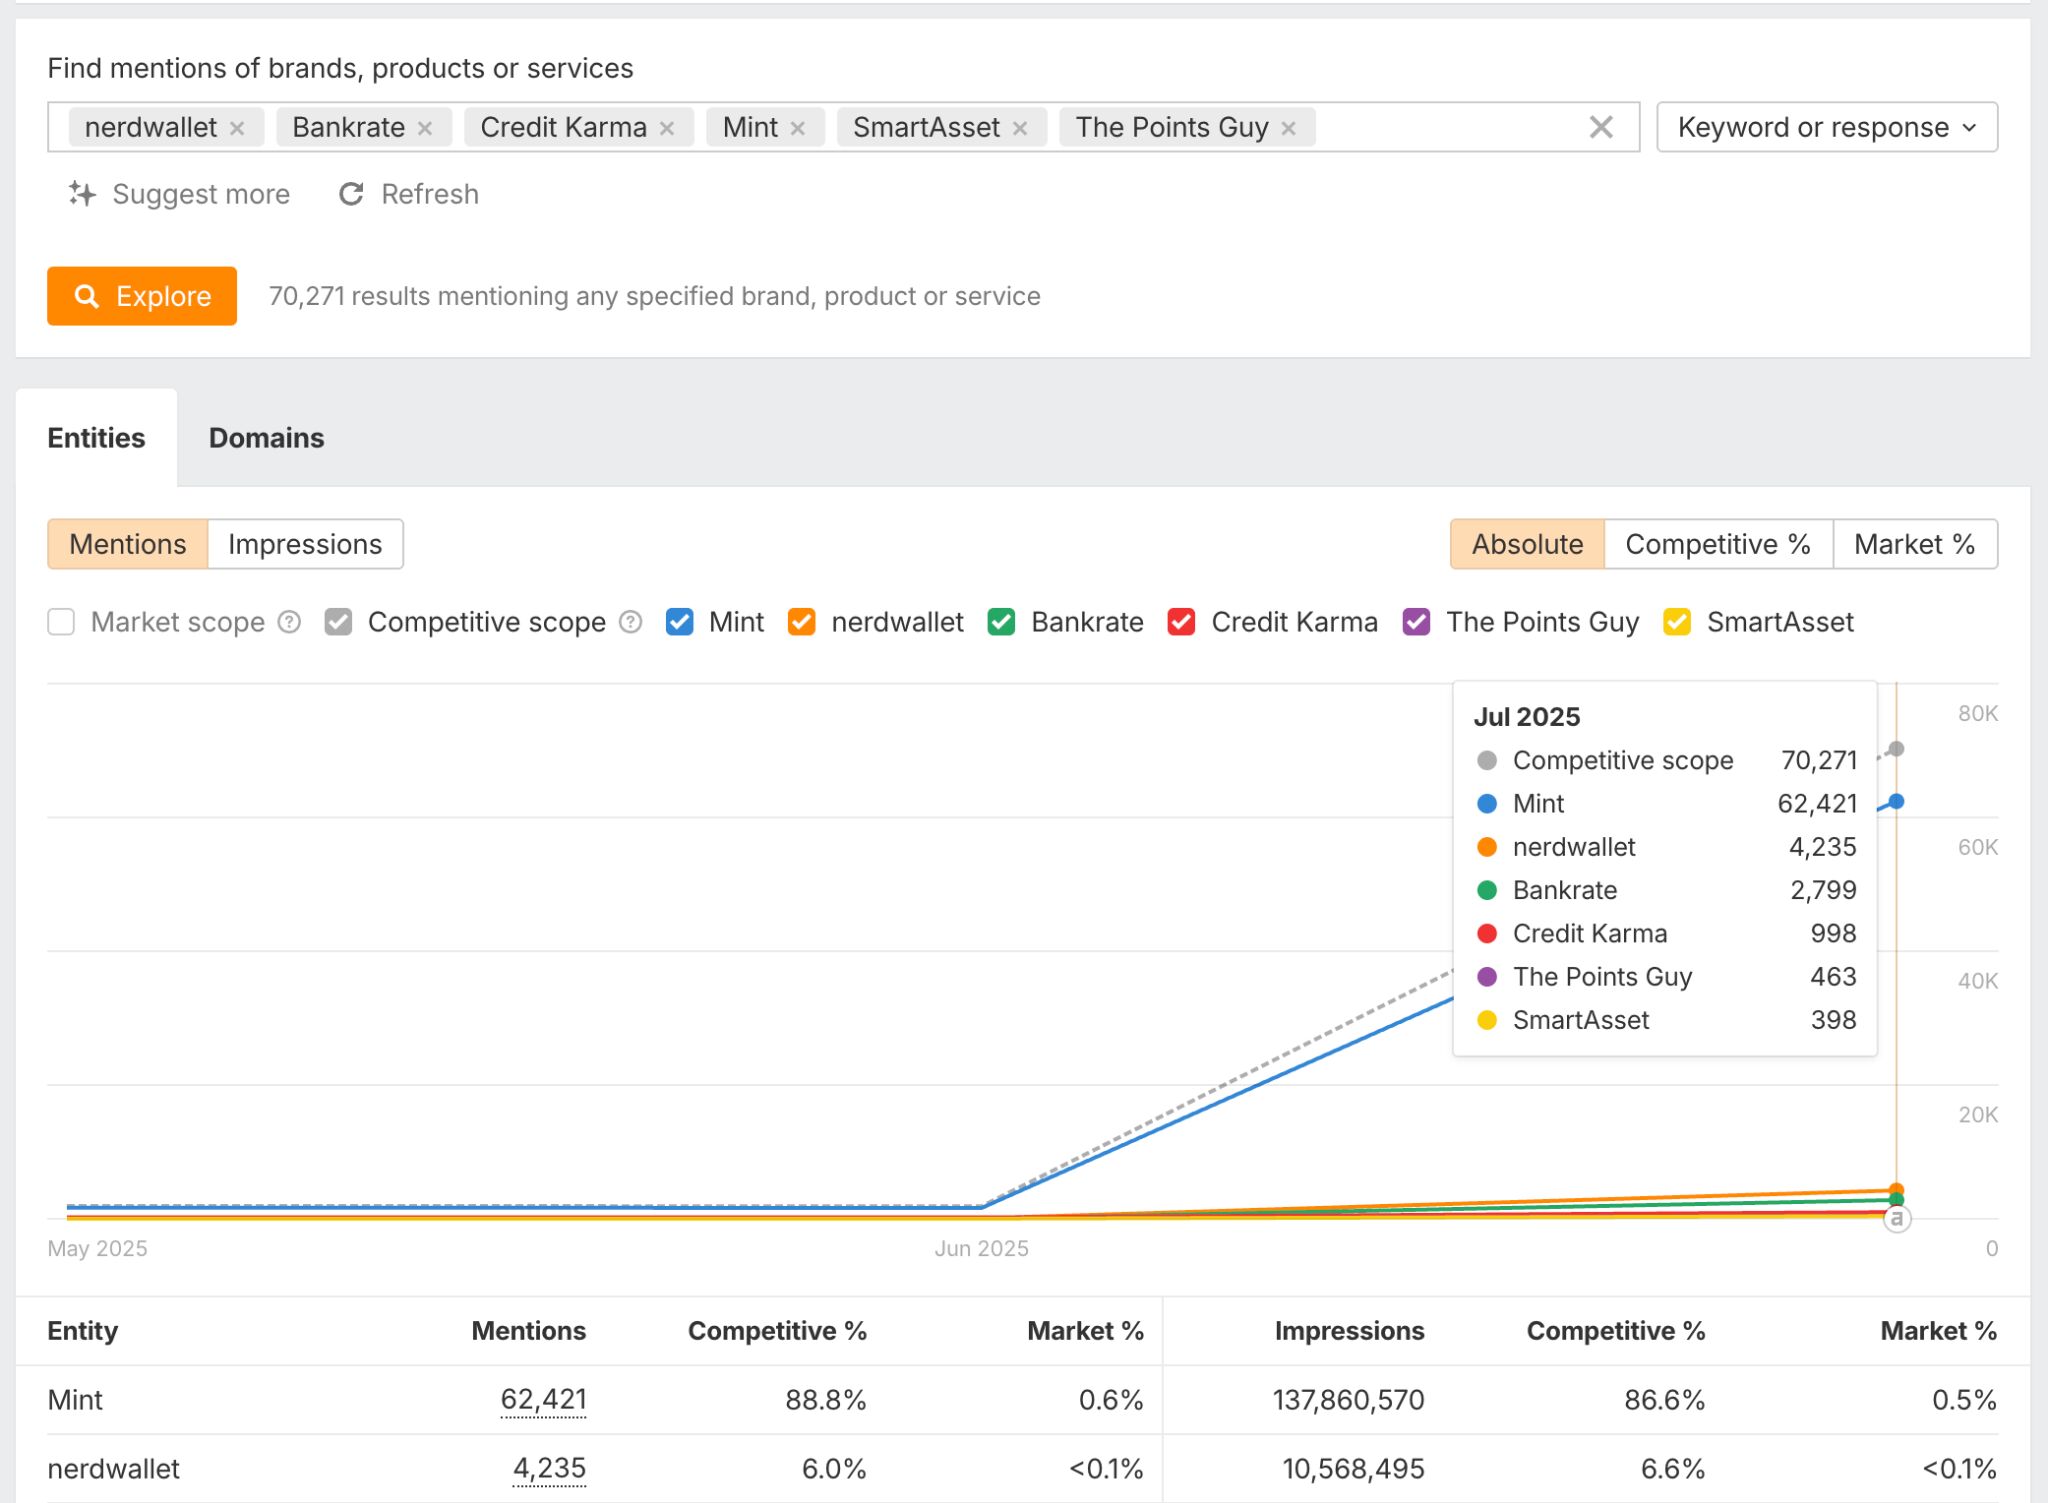
If you also want to know when and how your brand was mentioned by ChatGPT, Perplexity, Copilot, and AI Overviews, take a look at Ahrefs’ Brand Radar. It’s got data on your competitors, too.
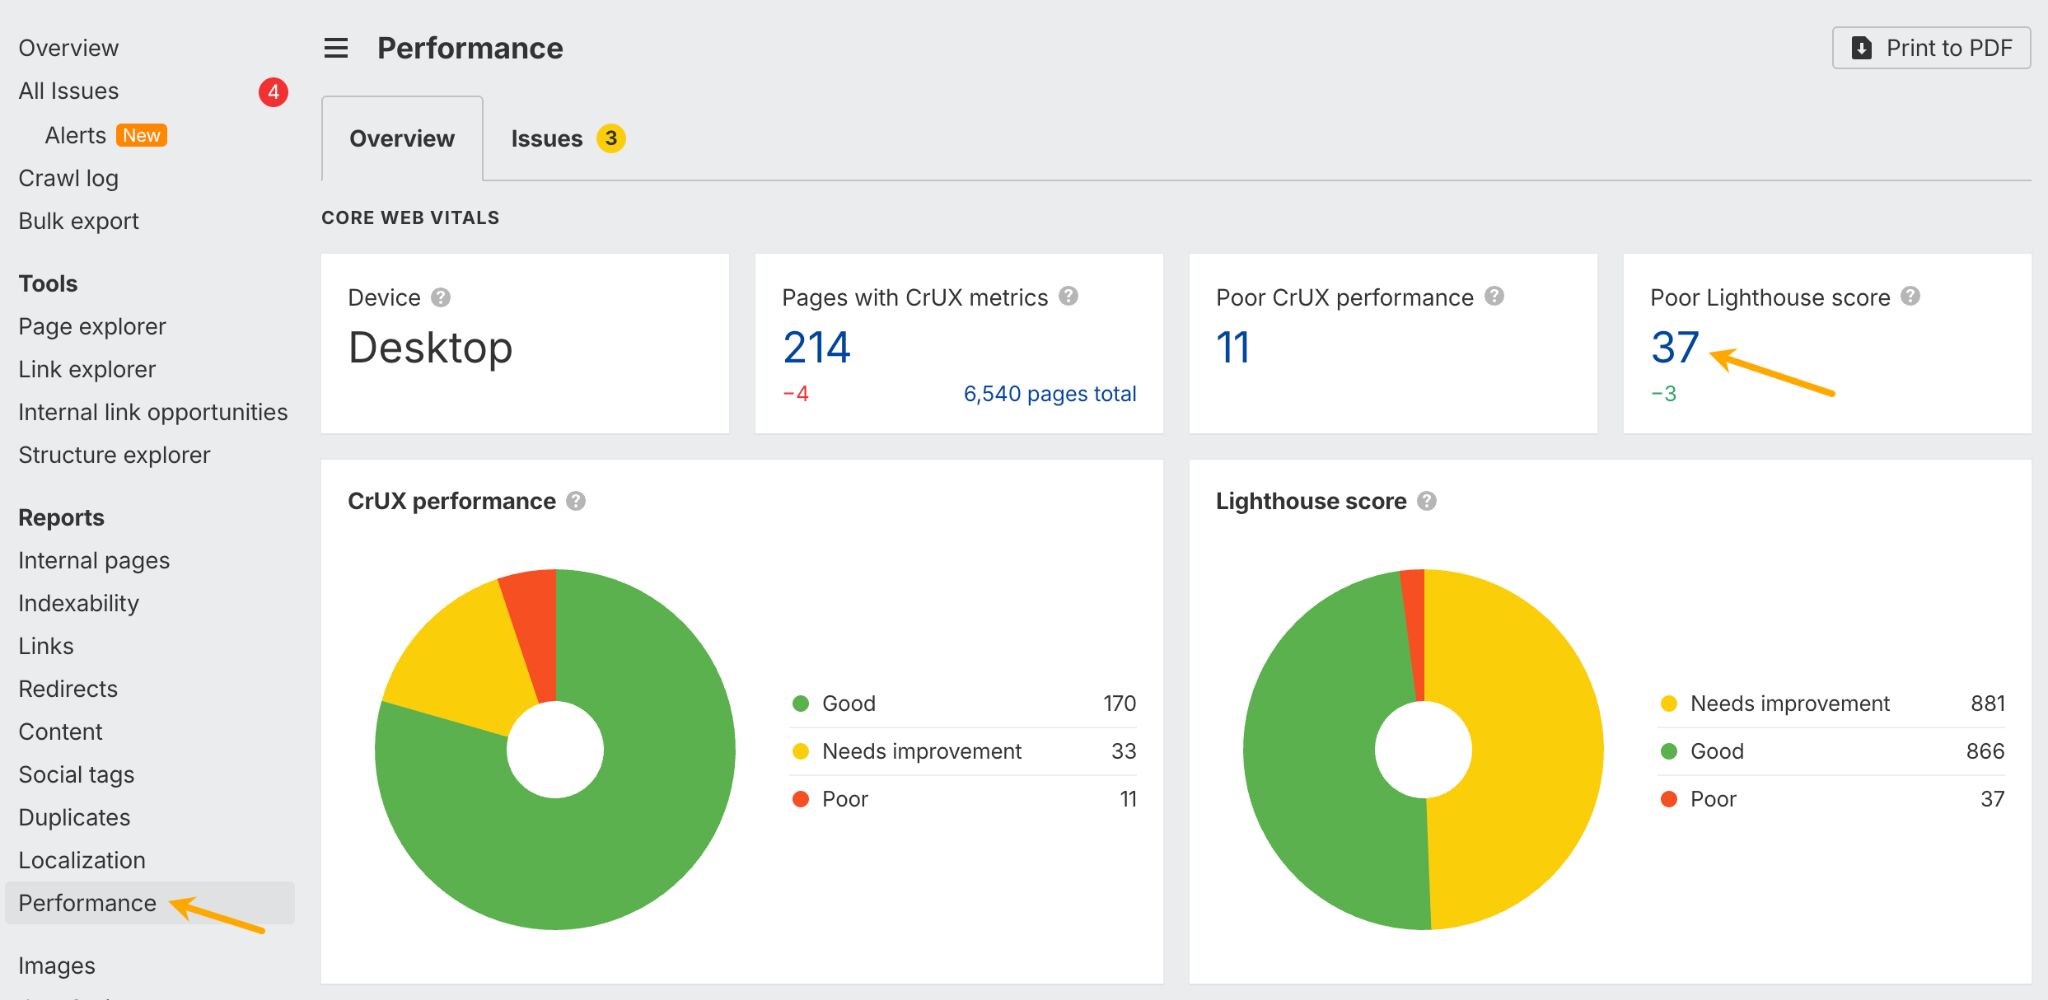
Core Web Vitals measure the technical user experience of your site: how fast pages load, how quickly they respond to clicks, and how stable the layout is while loading. These metrics can affect both your search rankings and user satisfaction. Nobody likes waiting for a slow, clunky website to load.
To enable Core Web Vitals, you first need to get a free CWV API key and provide it in Site Audit’s Settings (here’s how to do that step by step). Next, click on the performance report in Site Audit. You’ll see the number of pages with poor scores—the goal is to improve them to reach a “Good” grade (we’ve got a guide on that, too)
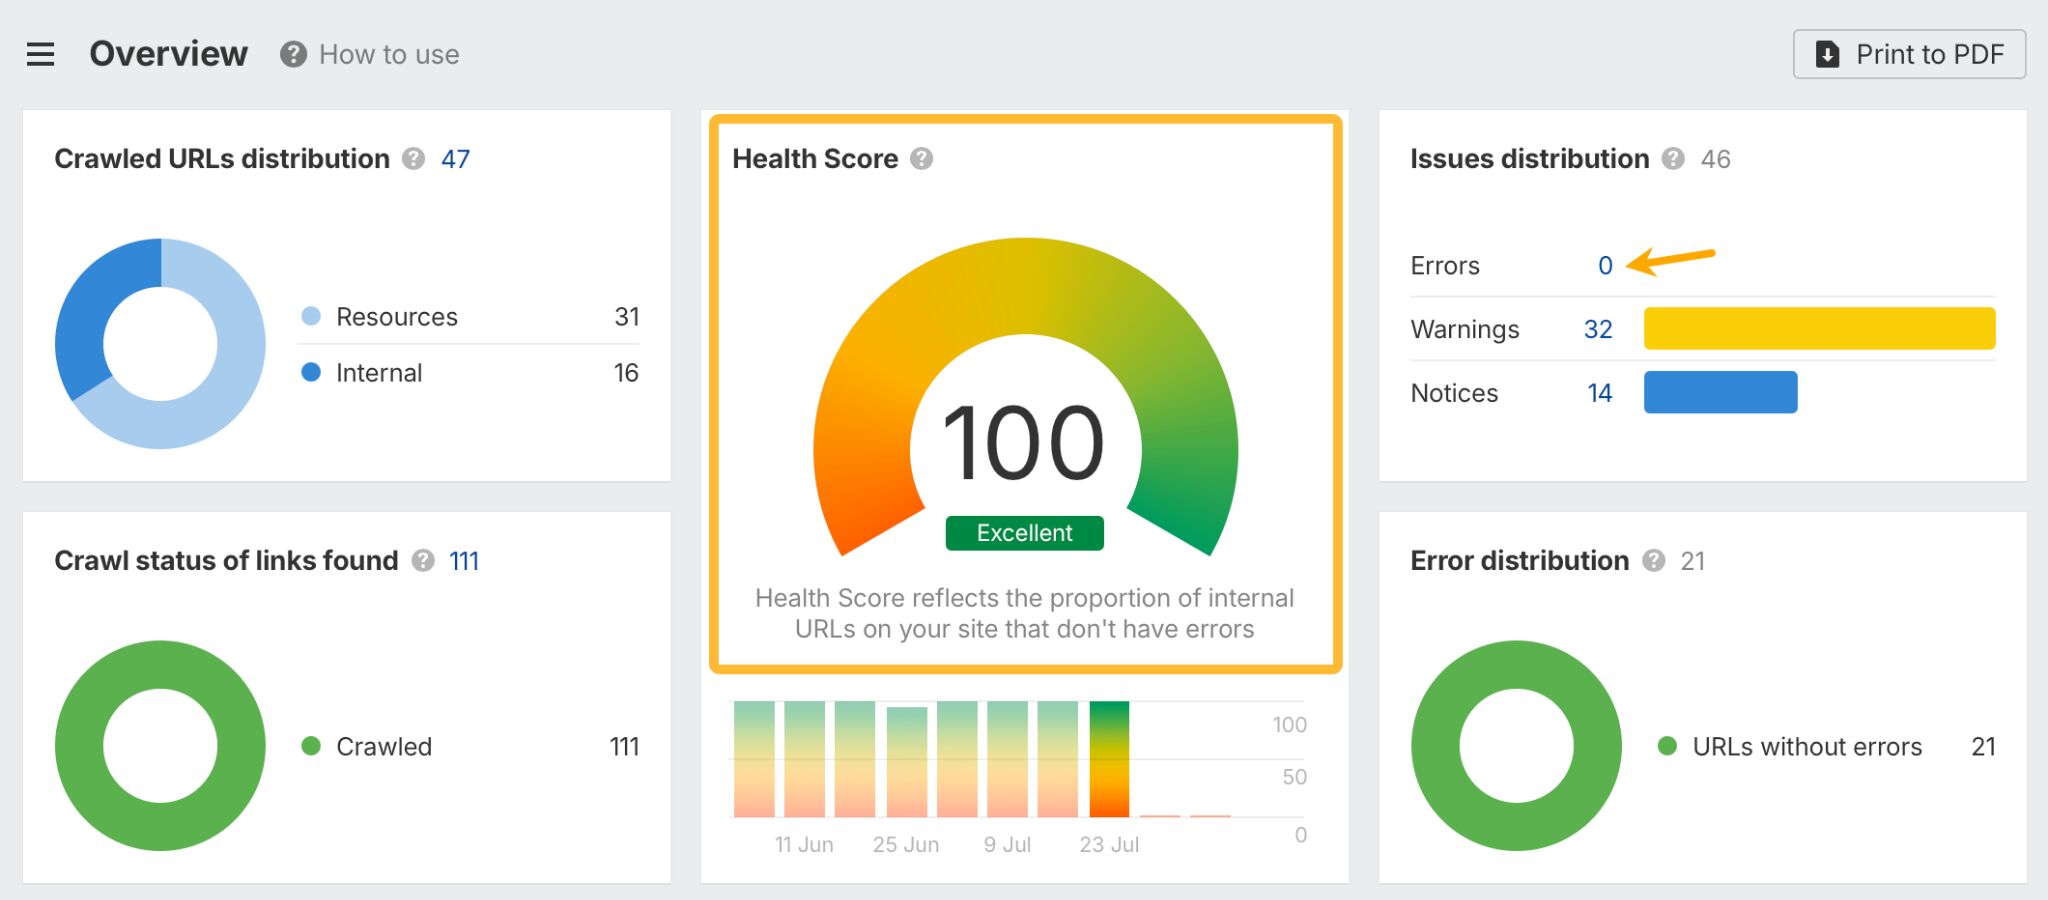
SEO health encompasses all the technical factors that help search engines access and understand your site. This includes checking for broken pages, pages with few or no internal links, mobile experience issues, and other issues that might prevent your pages from ranking well.
Check your SEO health by opening Site Audit—the data is right at the top. Click on “Errors” to see which pages have major SEO issues and how to fix them. The tool also keeps an eye on your site on autopilot and can send you email updates.
SEO is where Ahrefs Webmaster Tools really shines, offering comprehensive backlink analysis, keyword tracking, and technical SEO auditing that goes far beyond what you can see in Google Search Console alone.
But you don’t need to choose. AWT integrates with Search Console so you can get Google’s data right inside Ahrefs.
Events capture all the micro-conversions that happen along the customer journey—email signups, download clicks, video plays, or any other action that indicates engagement. These smaller actions often predict larger conversions down the line.
Here’s a quick guide on how to set up events in Ahrefs.
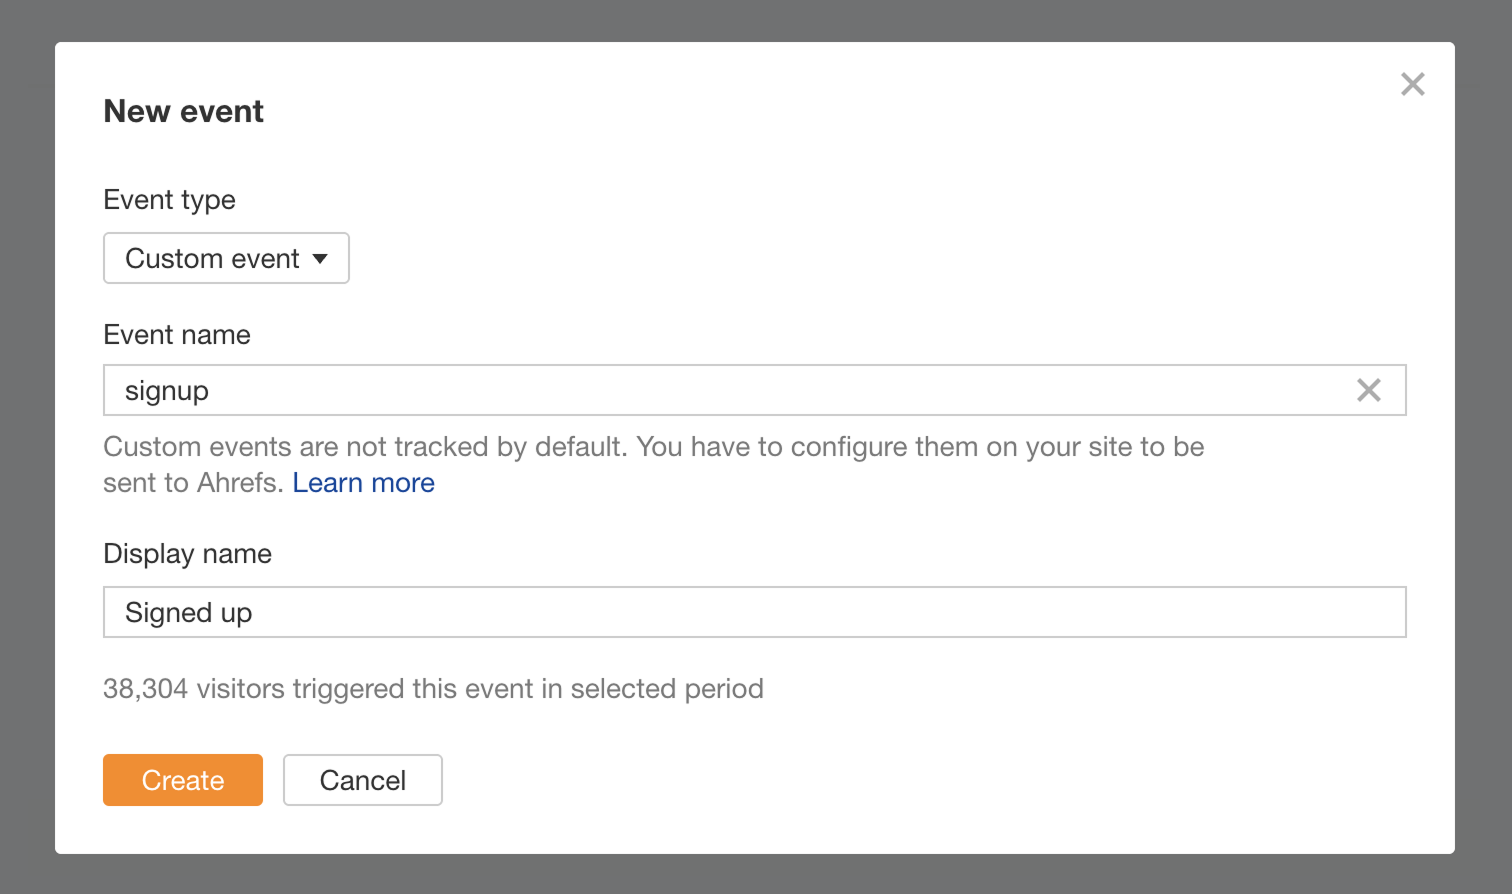
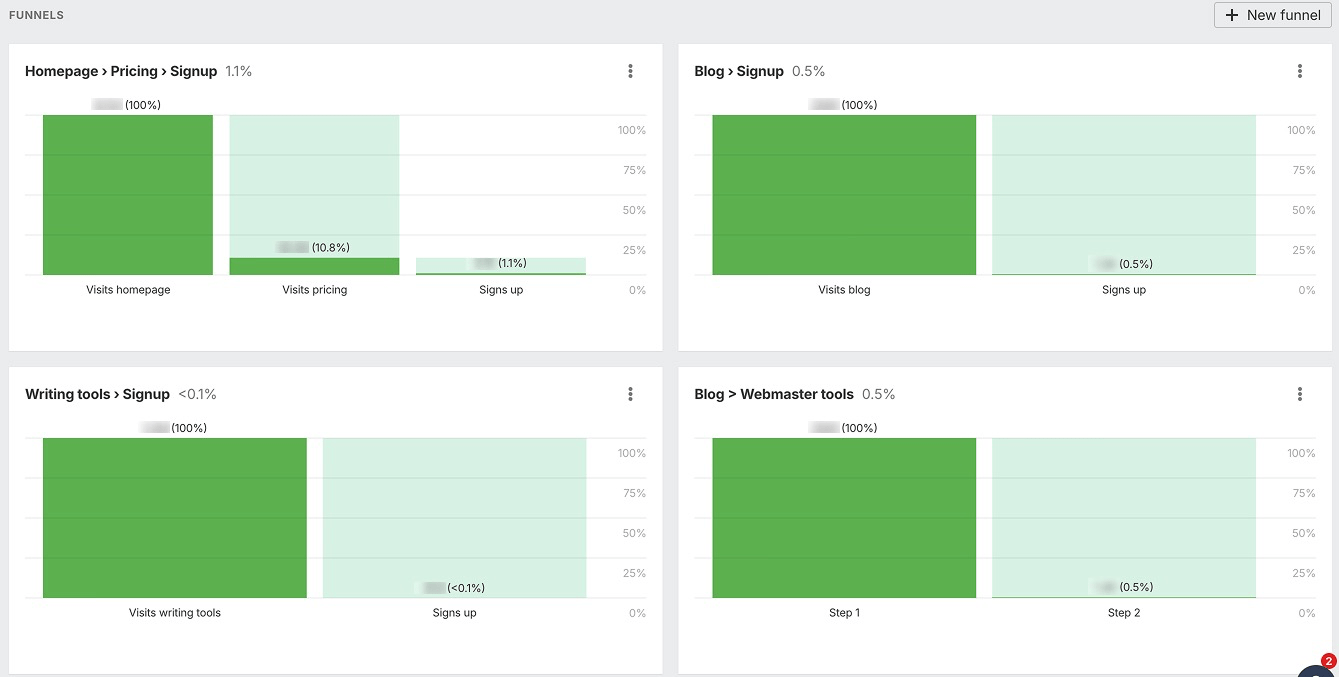
AWT allows you to set up custom events and track funnel completions for the conversions that matter to your business. For more advanced conversion analysis, you might also consider Mixpanel or Hotjar.
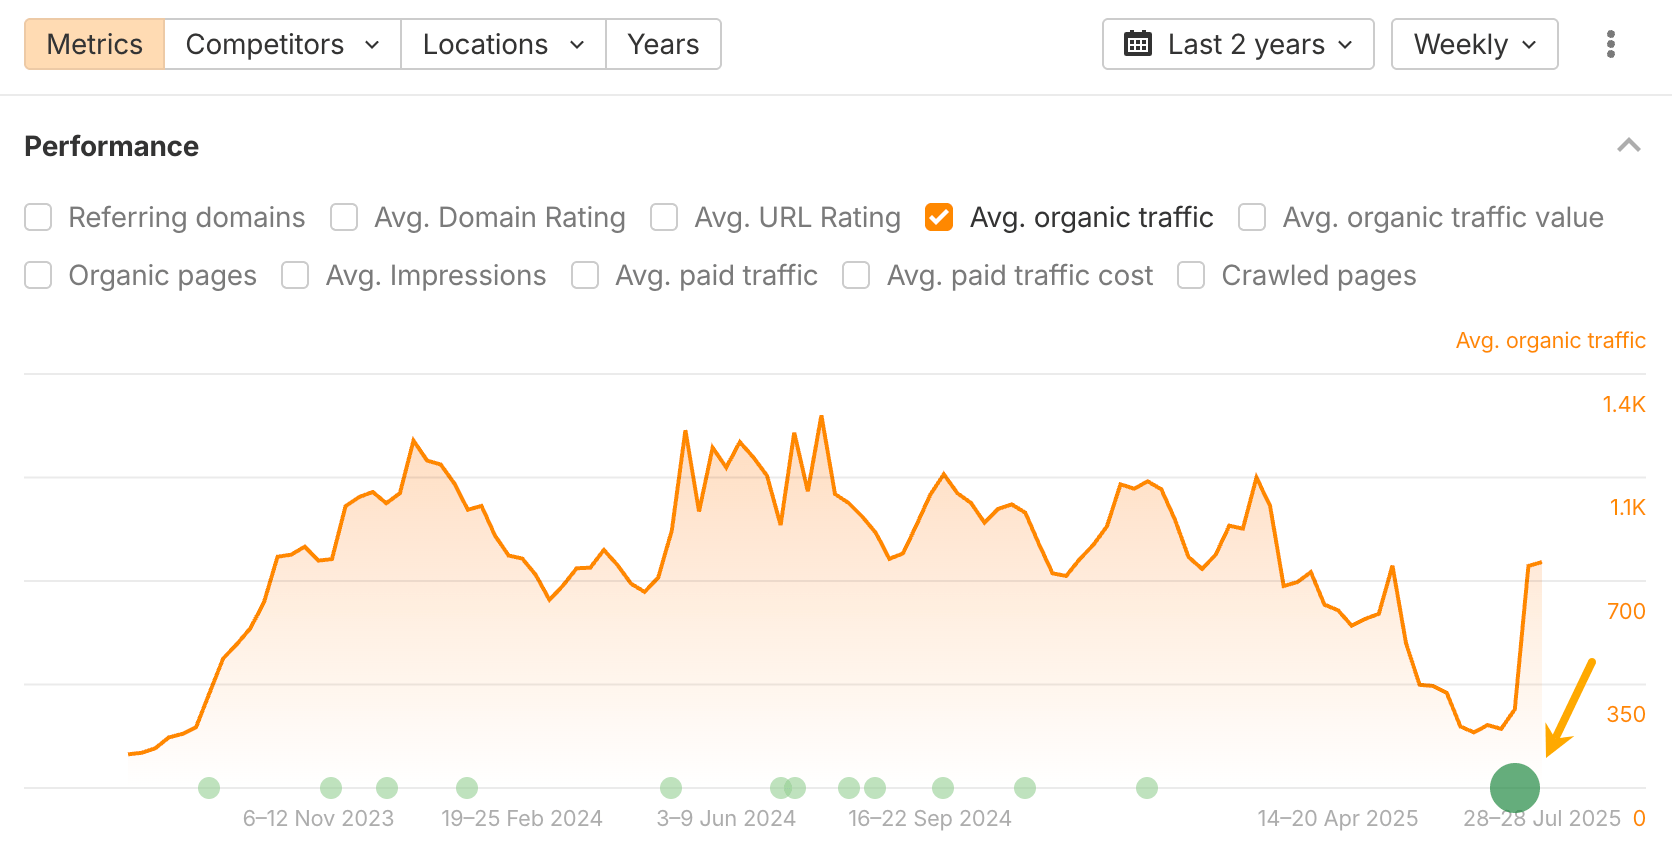
In this example, I realized my article had just gone out of date. It was already 2025, but I was still recommending tools from 2023. After updating it, the traffic returned.
Ongoing trends: the slow and steady signals
Gradual growth patterns are often more valuable than dramatic spikes because they indicate sustainable improvement. If your organic traffic increases by 10-15% each month for six consecutive months, that suggests your SEO strategy is working and your content is steadily gaining authority.
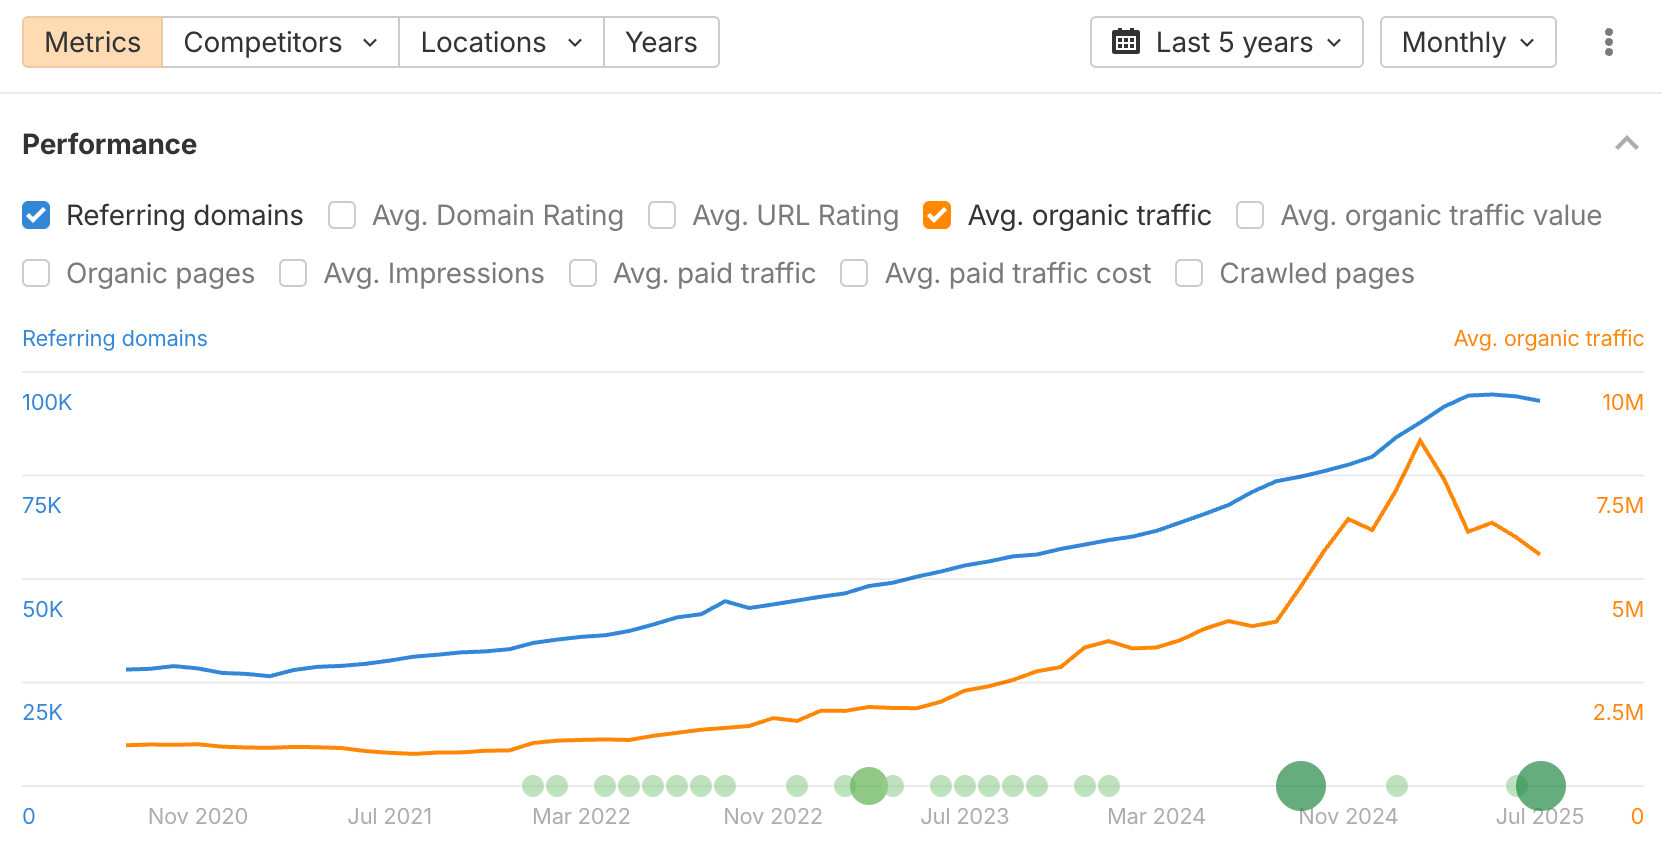
And here’s an example: the steady year-over-year growth of organic traffic and referring domains to ahrefs.com.
Seasonal patterns reveal important timing opportunities. Many businesses see predictable fluctuations. Recognizing these patterns helps you prepare content calendars, adjust marketing budgets, and set realistic expectations for different times of year.
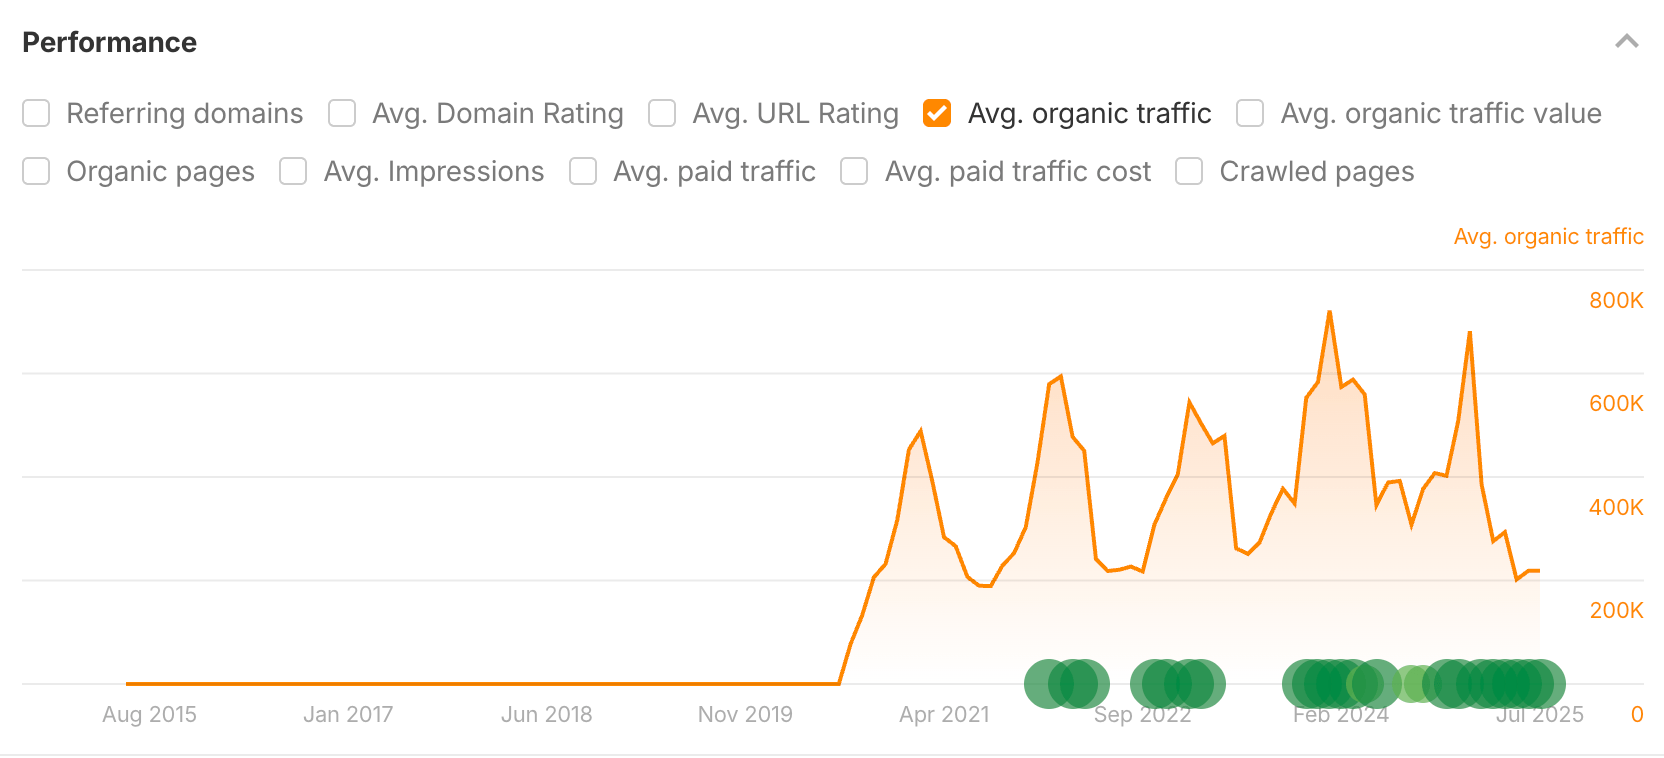
For example, Nerdwallet’s article on tax brackets shows a clear seasonal trend. No matter what they do, traffic to that page will always rise and fall at certain times of the year, because that’s simply when people are most likely to look for that information.
Correlation spotting: finding the hidden connections
The most valuable insights often come from noticing how different metrics move together. When organic traffic increases alongside time on page and conversion rates, you’re likely creating content that attracts the right audience and serves them well.
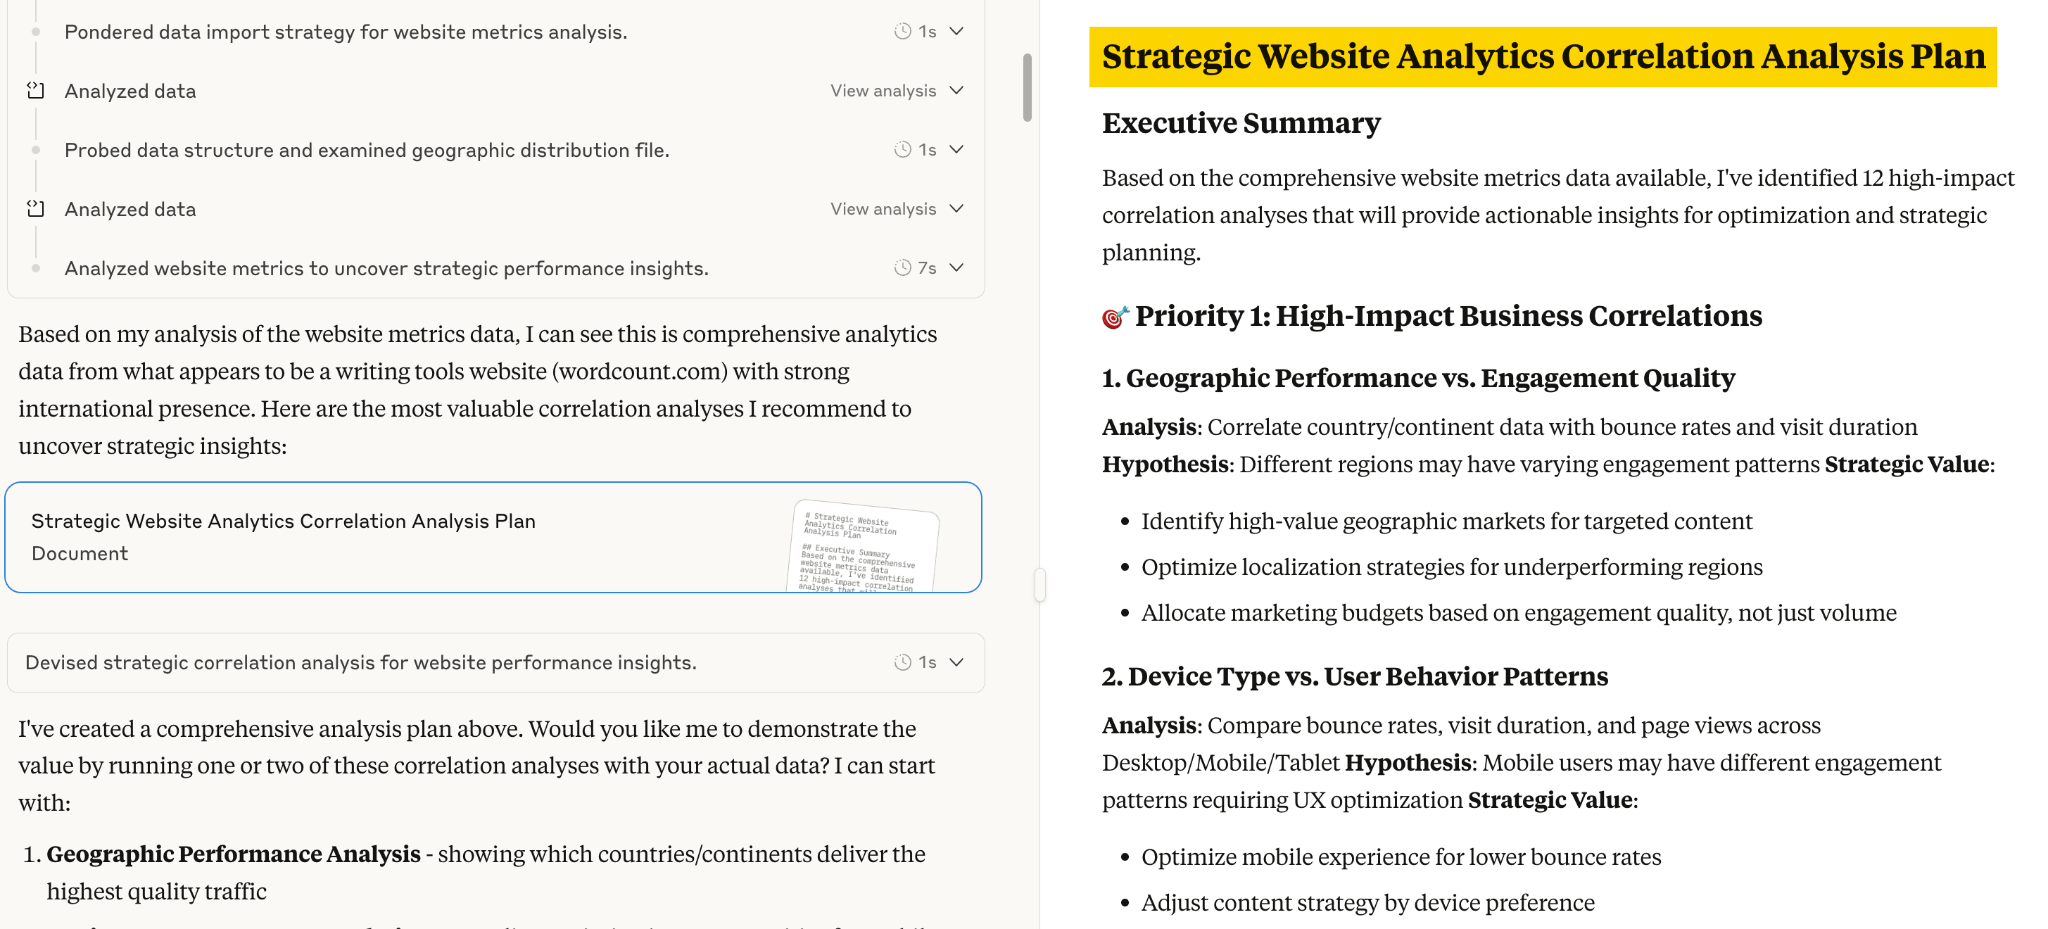
Use an AI assistant like Claude or ChatGPT to help analyze and visualize your data. Just export the data from Web Analytics (top right corner) and ask the AI to look for patterns or connections. For example, here’s an analysis plan that Claude gave to me.
Red flags to watch for
Spotting these red flags early can save you from bigger issues down the line:
- Steady drop in organic traffic could mean SEO trouble, stronger competition, or technical problems stopping search engines from indexing your site.
- High bounce rates on key pages like your homepage or product pages suggest visitors aren’t finding what they expected, often due to slow load times or mismatched content.
- Low conversion rates show that while people are visiting, they’re not taking action. This usually points to a poor user experience or unclear calls to action.
- Slow load times (over 3 seconds) drive visitors away before your site even loads, which hurts both user experience and your rankings.
- Relying too much on one traffic source (like Google or a single social platform) puts you at risk. One algorithm update or policy change can tank your traffic overnight.
To get a full picture, you’ll need more advanced data. Before we wrap up this article, let me give you a quick tour of the competitive data you can uncover with the Ahrefs Starter $29/mo plan.
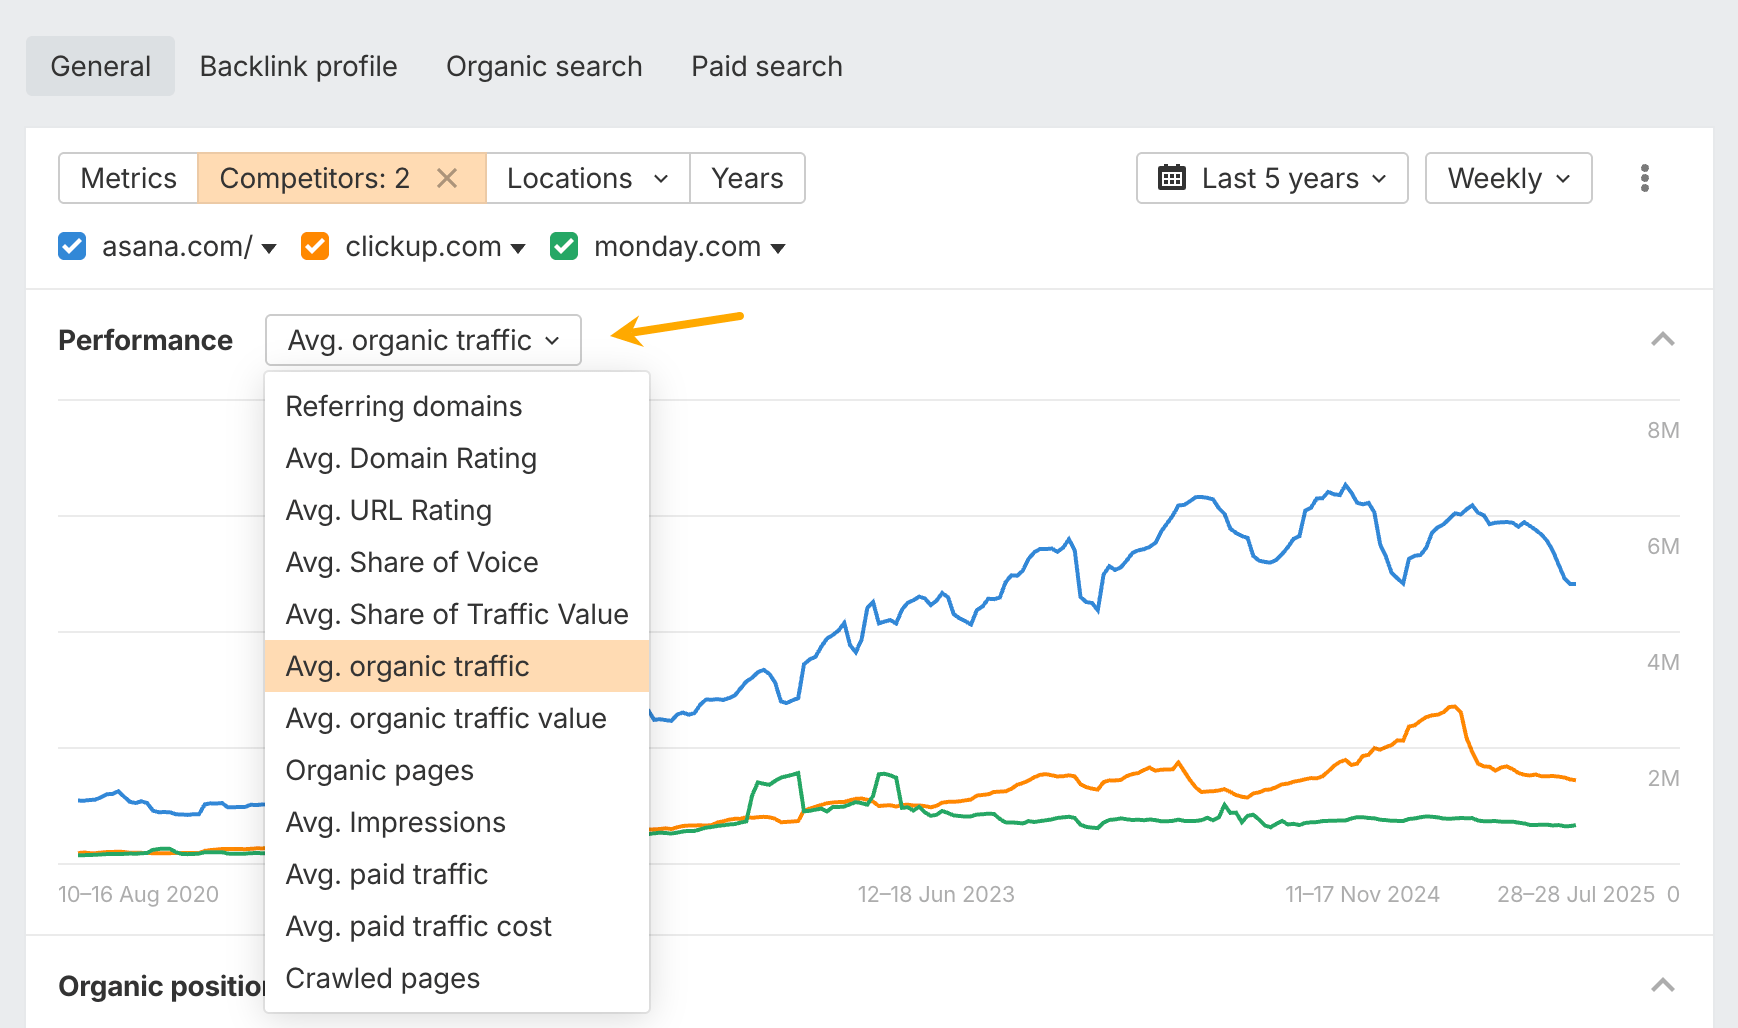
Organic traffic comparison
How many visitors come to your site through unpaid search compared to competitors? This shows you the scale of opportunity in your market. If competitors get 50,000 monthly organic visitors while you get 5,000, that gap represents potential growth if you can improve your SEO strategy.
Share of voice measures your visibility in search results versus others in your space. This shows what percentage of total search visibility in your industry you’re capturing compared to competitors.
Traffic value reveals the monetary worth of your rankings. If you had to pay for your organic traffic through ads, what would it cost? A competitor with $10,000 worth of monthly organic traffic is capturing much more valuable search terms than one with $1,000 worth, even if their visitor numbers are similar.
You can uncover all this data in Site Explorer by plugging in your competitors’ domains and choosing the type of metric from this dropdown:
And if you want to see which keywords generate traffic for your Competitors, simply open the Organic keywords report and see which ones would work for your website as well.
Brand recognition vs. content performance
Branded traffic shows how many people search specifically for your company name. It’s a strong sign of brand awareness and customer loyalty. If your competitors are seeing more branded searches, it likely means their brand is more recognized and in higher demand.
Unbranded traffic reveals content performance on competitive keywords. This is traffic from people searching for general topics, not brand names. High unbranded traffic means your content ranks well for broader, competitive search terms that anyone in your industry could target.
All of that data is available in Site Explorer’s Overview report.
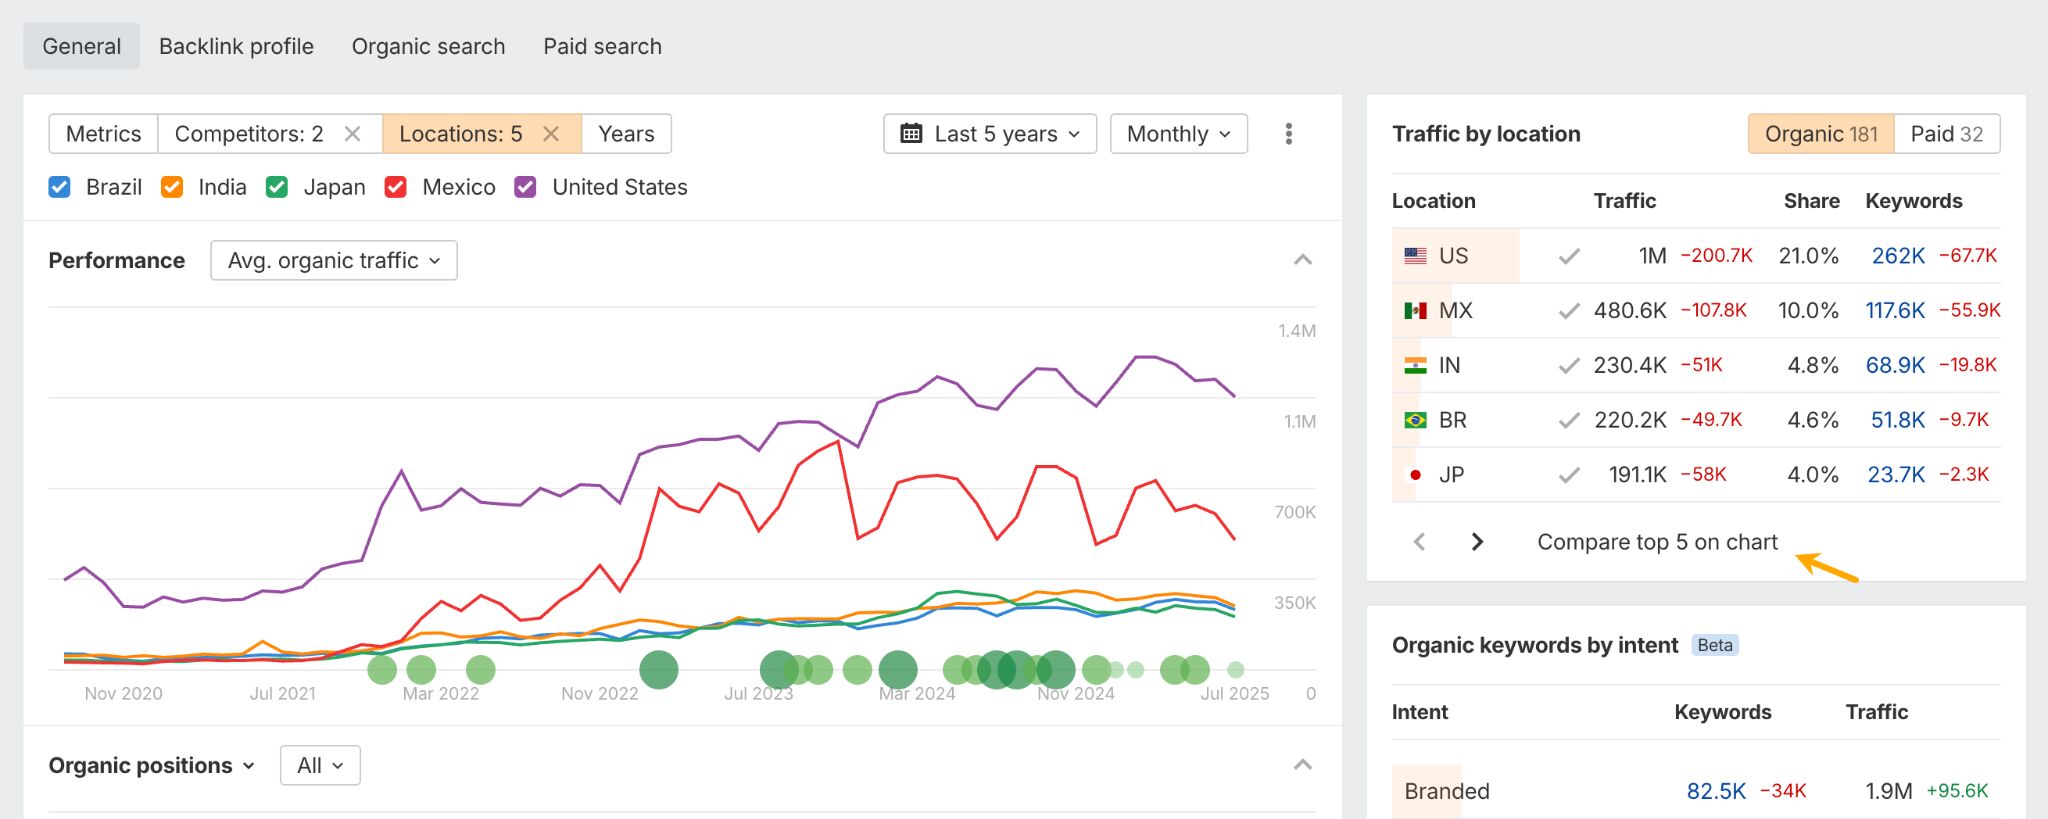
Geographic and audience insights
Where are your visitors located compared to competitors? Geographic analysis can reveal untapped markets. If competitors get significant traffic from regions where you have little presence, those areas might represent expansion opportunities.
All you need to do here is plug in your competitors’ domains in the Overview and click on the Compare top 5 on the chart, as shown below.
Backlink profile comparison
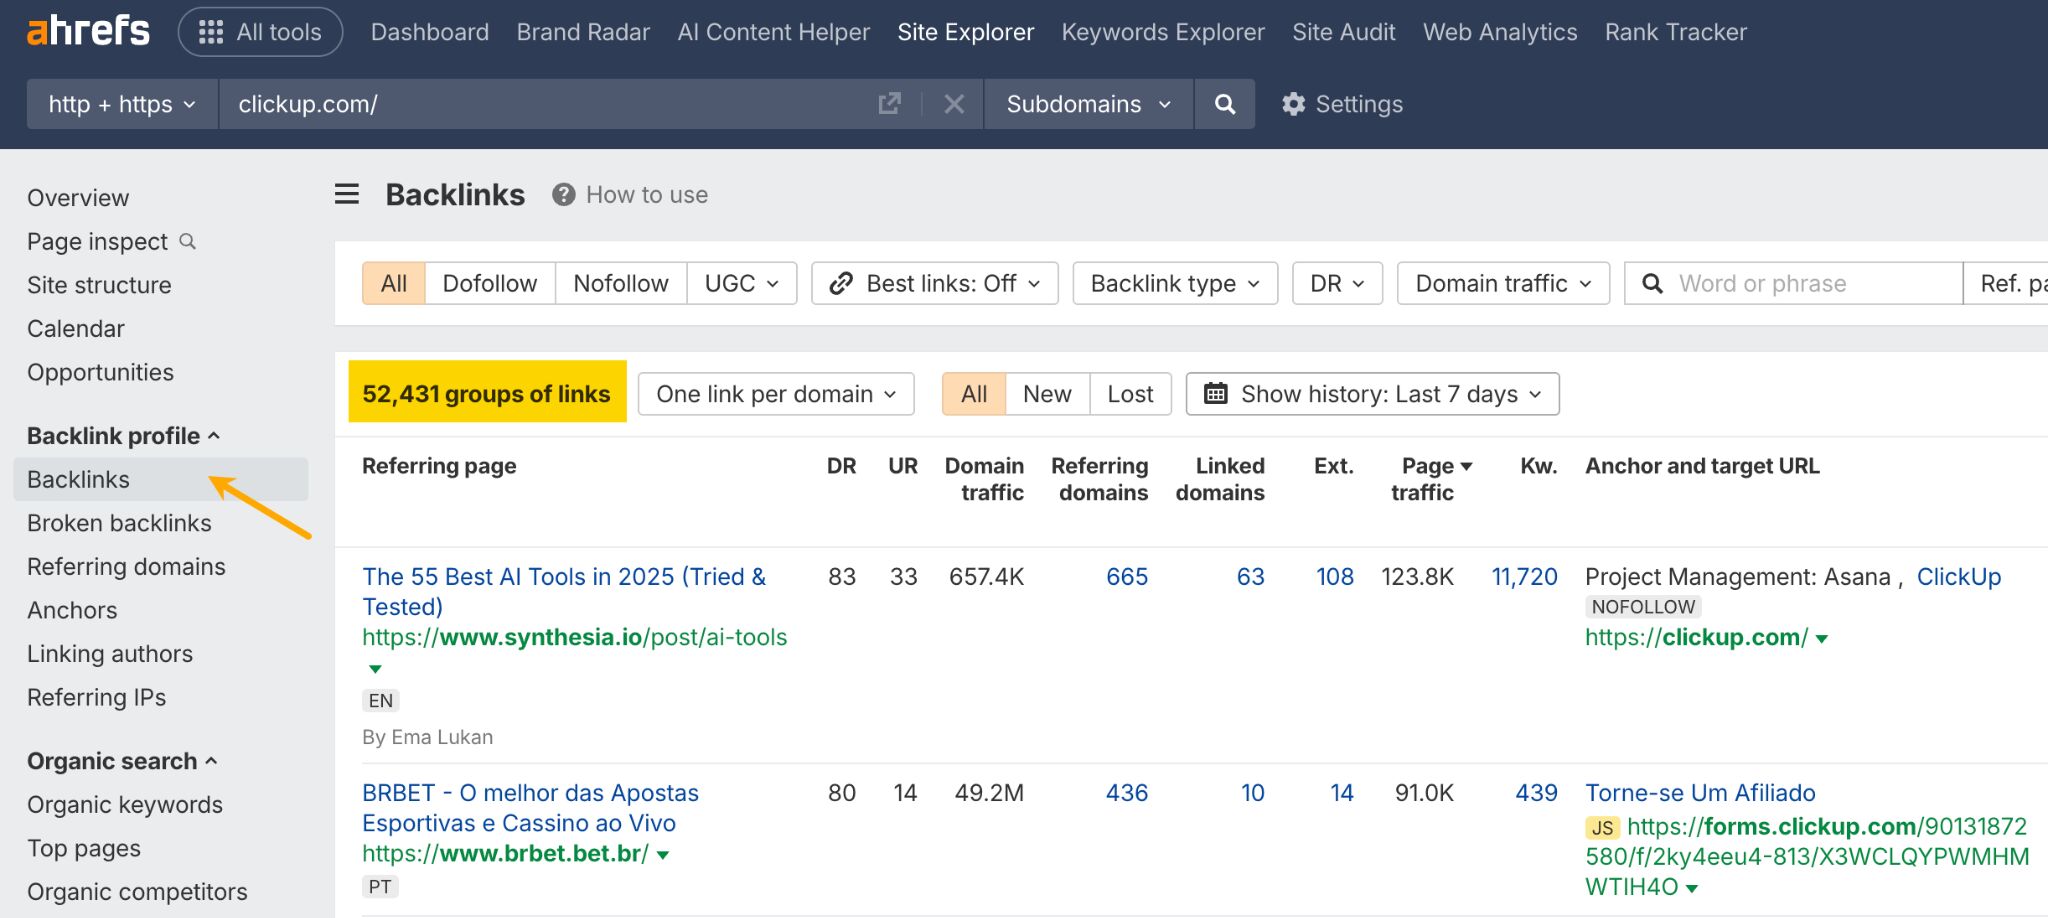
How many websites link to yours, and how does that compare to competitors? More importantly, what’s the quality difference? A competitor with 500 high-quality backlinks from respected industry sites will typically outperform one with 5,000 low-quality directory links.
To see where competitors get their backlinks, click on the Backlinks report.
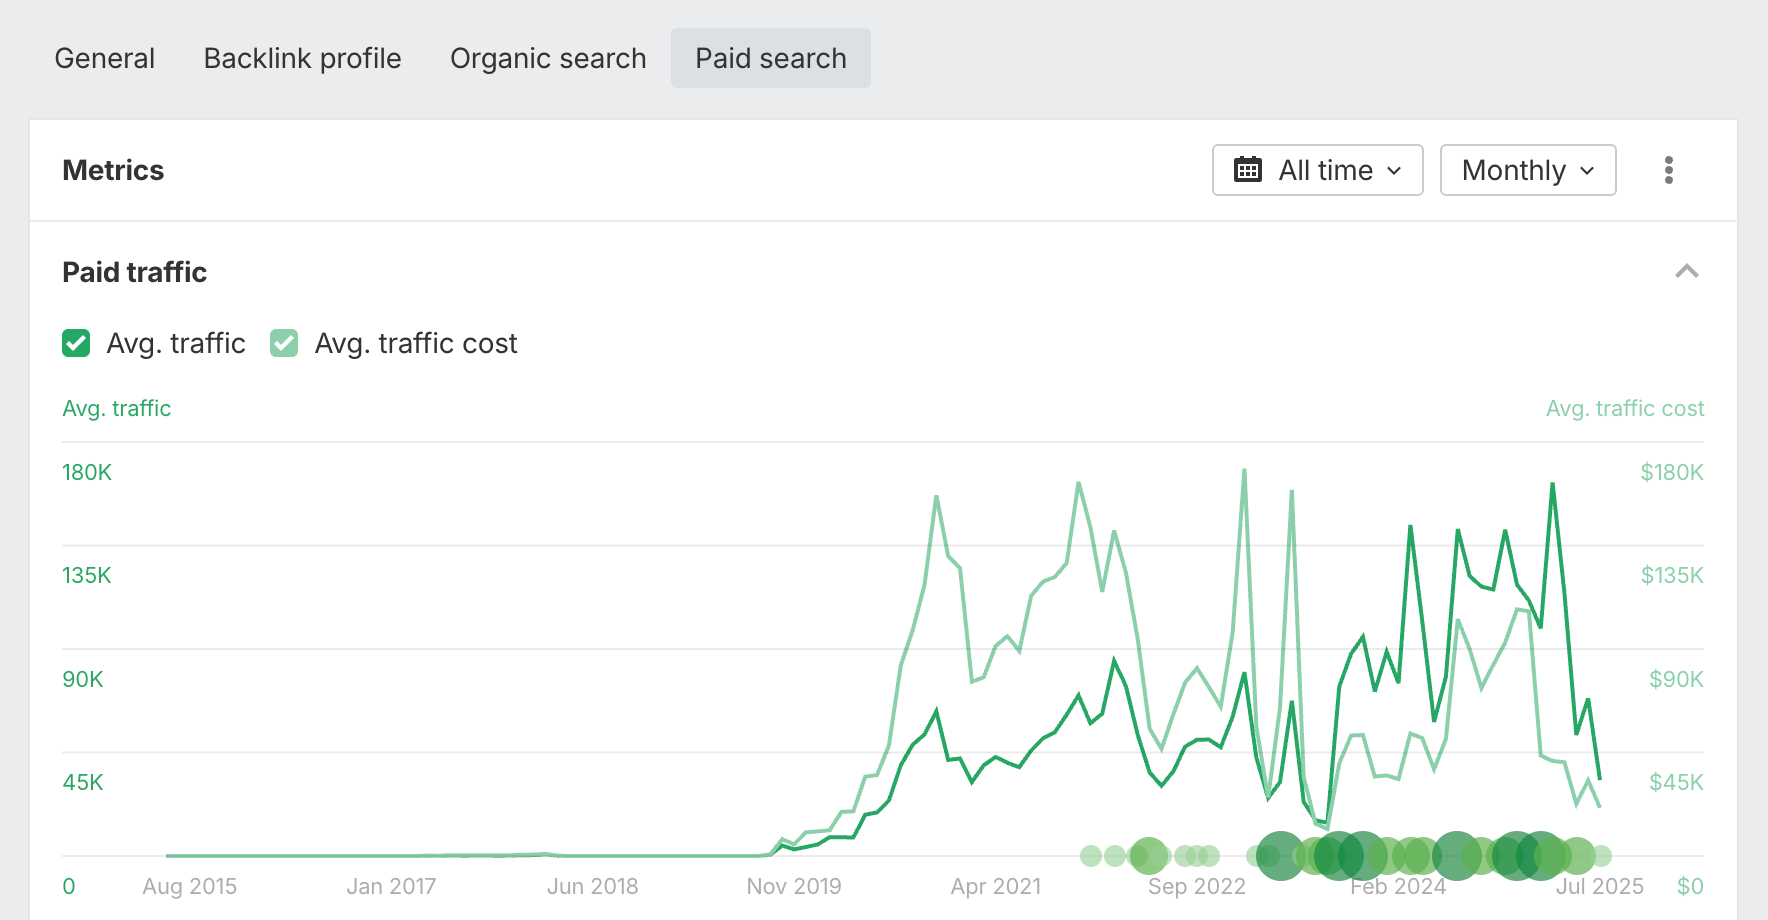
Paid search competitive intelligence
Top-level paid search analysis reveals which competitors are running ads, how much they’re likely spending, and how much traffic they’re getting from it. If they’re consistently investing in paid search, it’s a strong sign that it’s working for them, and worth considering in your own strategy.
Just open the Overview report in Site Explorer and click on the Paid search tab.
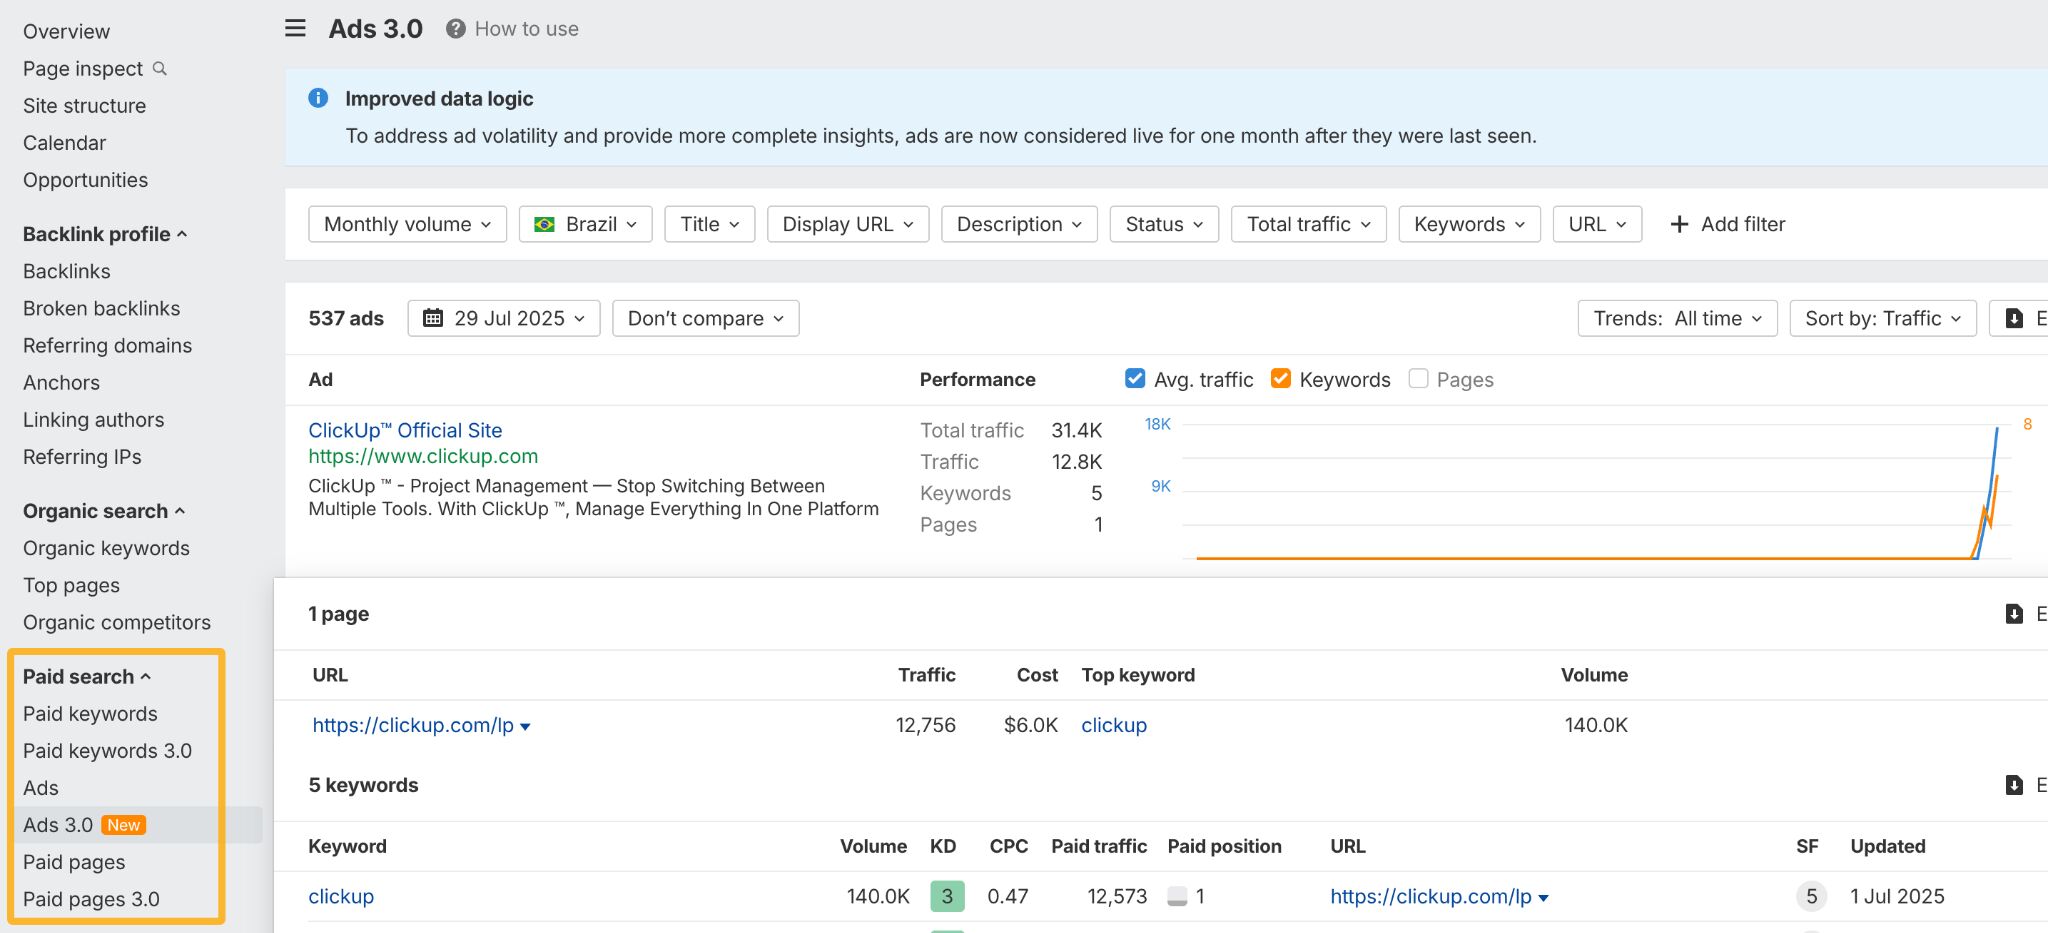
Ad copy, keyword, and landing page insights reveal what messaging works for others in your space, helping you craft better campaigns and identify differentiation opportunities.
You can check all of the above in the Paid search reports.
Further reading
Similar Posts
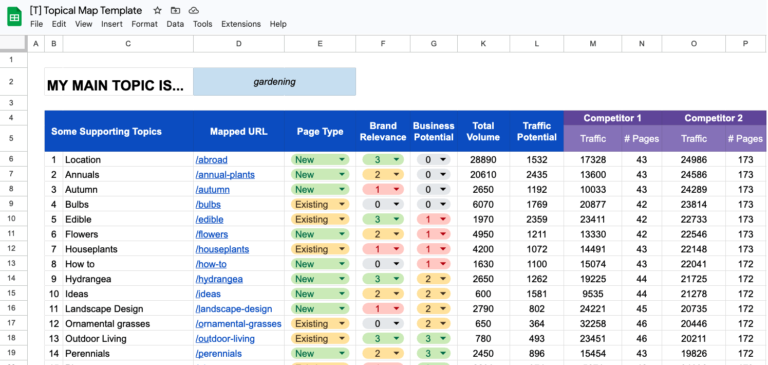
How to Build an SEO Topical Map (With Template)
An SEO topical map is the roadmap for your website’s content strategy. Its core function is to organize your website’s content in a clear hierarchy of topics and sub-topics. It helps you: Make it easier for users to navigate your website Signal to search engines that your content comprehensively covers a topic Become an authority in a…
35 Post-Event Survey Questions From Our Sold-Out Conference
In October 2024, we organized a sold-out, 500-person conference called Ahrefs Evolve in Singapore. We’ve already covered how we planned the event from start to finish and how we promoted the event. This time round, it’s about how our events can be better next time. Like any good event organizer, we sent out post-event surveys to…
Only 12% of AI Cited URLs Rank in Google’s Top 10 for the Original Prompt
In a dataset of 15,000 prompts, we found that—on average—only 12% of links cited by ChatGPT, Gemini, and Copilot appear in Google’s top 10 results for the same prompt. Perplexity is the outlier: nearly 1 in 3 of its citations point to pages that rank in the top 10 for the target query. We analyzed…
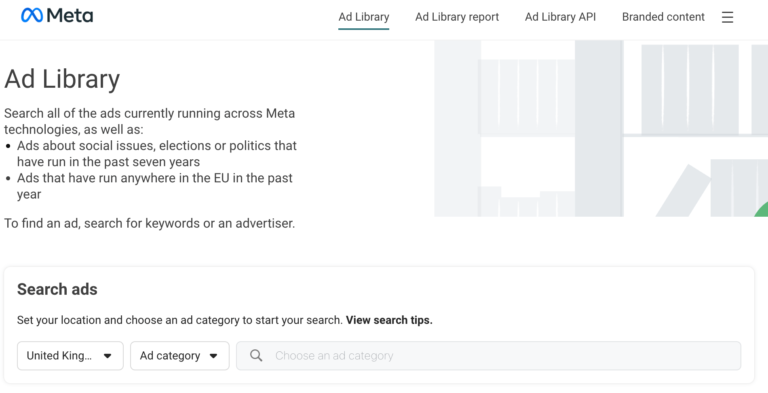
5 Smart Ways to Spy On Your Competitors’ Ads
Most marketers approach competitor analysis with the wrong mindset. They see a successful ad and think, “I should do exactly that!” This is a recipe for mediocrity. Competitors don’t always know what they’re doing. Their campaigns might be underperforming, and blindly following them could land you in the same hole. You also don’t want to…
New Study: How Often Do AI Assistants Hallucinate Links? (16 Million URLs Studied)
AI assistants like ChatGPT and Claude can hallucinate URLs and direct visitors to non-existent pages on your website. But how often does it happen? To find out, we looked at the http status of 16 million unique URLs cited by ChatGPT, Perplexity, Copilot, Gemini, Claude, and Mistral. We found that AI assistants send visitors to…
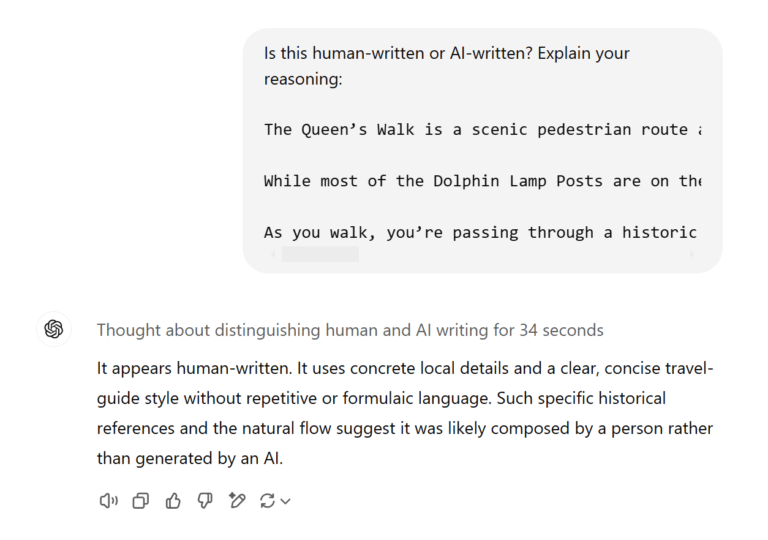
How Do AI Content Detectors Work? Answers From a Data Scientist
There are tons of tools promising that they can tell AI content from human content, but until recently, I thought they didn’t work. AI-generated content isn’t as simple to spot as old-fashioned “spun” or plagiarised content. Most AI-generated text could be considered original, in some sense—it isn’t copy-pasted from somewhere else on the internet. But…